M-mode, or the motion mode is used to image moving structures and measure their degree of motion over time. While we use it as an adjunct to 2-dimensional echocardiography (= regular greyscale ultrasound), M-mode has actually been used to image the heart long before the 2D imaging was developed. In this post, I will briefly go over the common applications of M-mode in focused cardiac ultrasound (FoCUS).
Inferior vena cava diameter:
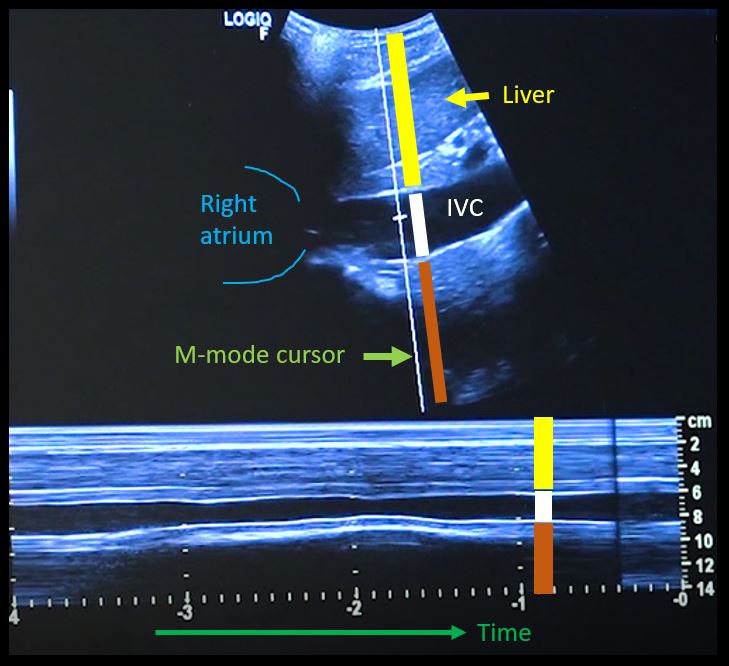
First, to understand this mode better, imagine you are standing at the finish line of a race and videotaping that location [Figure 1]. You only care about what happens ‘at the line’ but not before or after that. Now let’s apply this to IVC ultrasound [Figure 2]. When you turn on M-mode, a white line (= cursor or vector) appears on the screen. You take that line to the region of interest, which is ~2cm below the IVC-right atrial junction in this context. Once the cursor is set, you will see a tracing on the screen, which plots the structures ‘along the line’ over time. This means, top portion of the tracing corresponds to liver, the black portion is the IVC and at the bottom is whatever is below the IVC [Figure 3]. Once the patient takes in a deep breath, you can freeze the image and measure the widest and narrowest diameter (= expiratory and inspiratory diameters respectively in a spontaneously breathing person) of the IVC and calculate percent change with respiration.

Limitations:
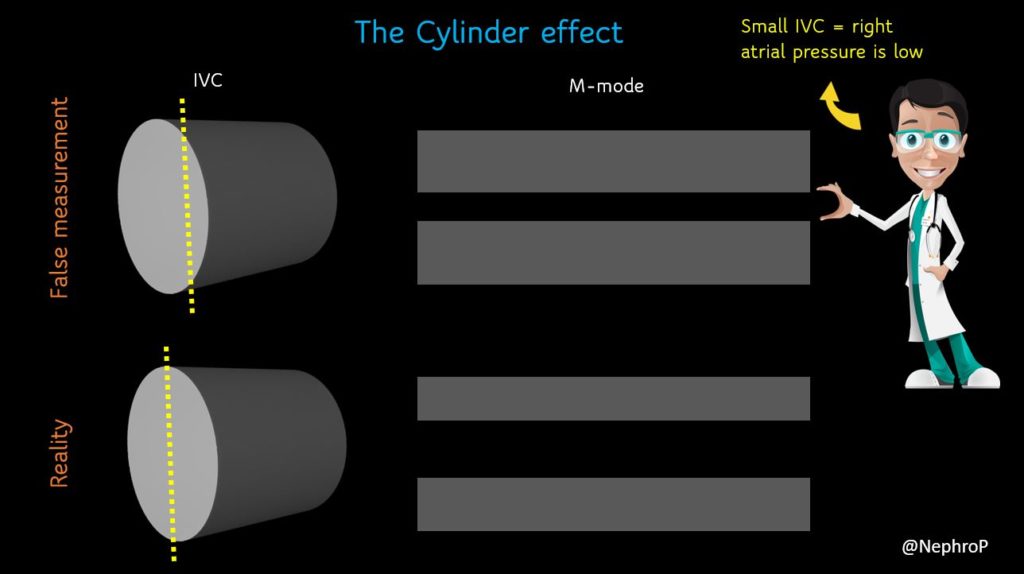
A major limitation of IVC M-mode is that the vessel moves mediolaterally and craniocaudally during respiration, with collapse occurring off axis from the true vertical. This gives erogenous measurements. Moreover, as we are measuring a 3-dimensional structure in 2 dimensions, it is possible that the ultrasound beam is slicing the vessel at periphery leading to false measurement, the so-called cylinder effect [Figure 4]. This typically happens when we are trying to hit the M-mode button on the machine and the probe position changes accidentally. Therefore, most experts prefer visually evaluating the diameter in the 2D mode than using M-mode for this purpose.
Left ventricular systolic function:
M-mode gives a semi-quantitative estimate of left ventricular ejection fraction (LVEF) and can be used in addition to visual estimation of LV function. There are two ways of assessing LV systolic function using M-mode in the parasternal long axis (PLAX) view.
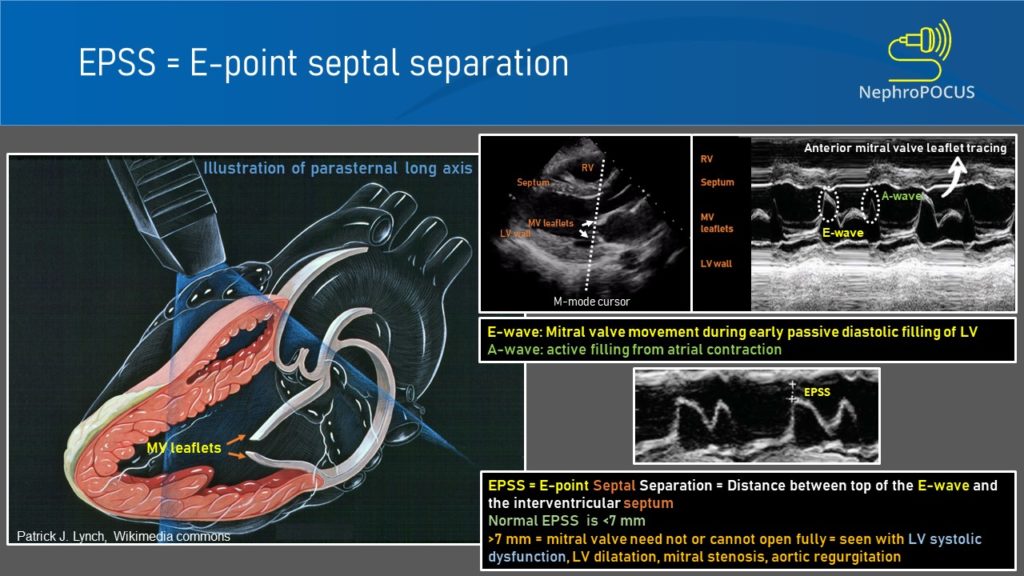
- E-point septal separation:
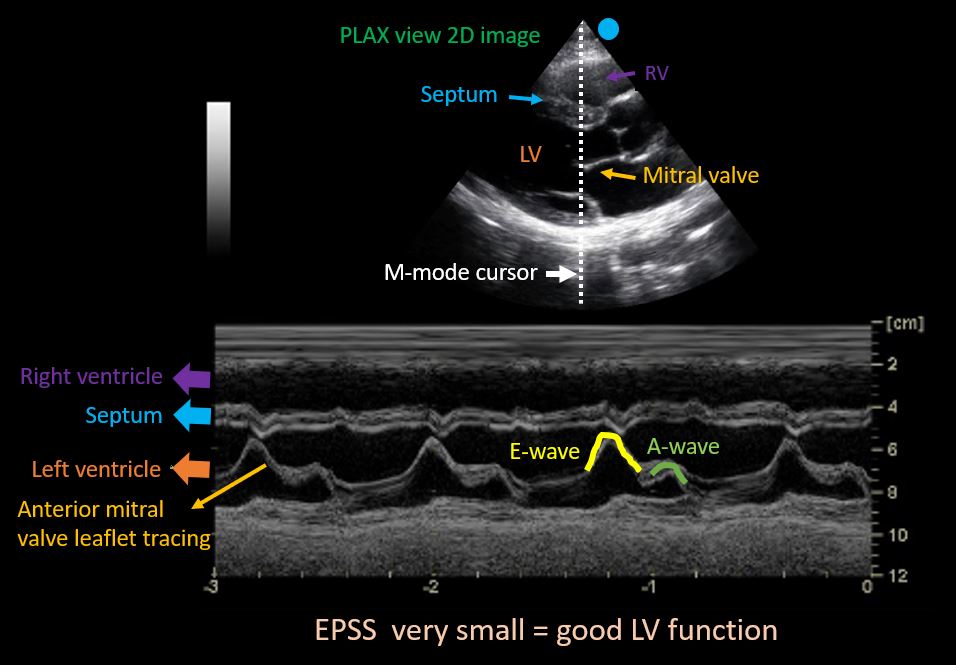
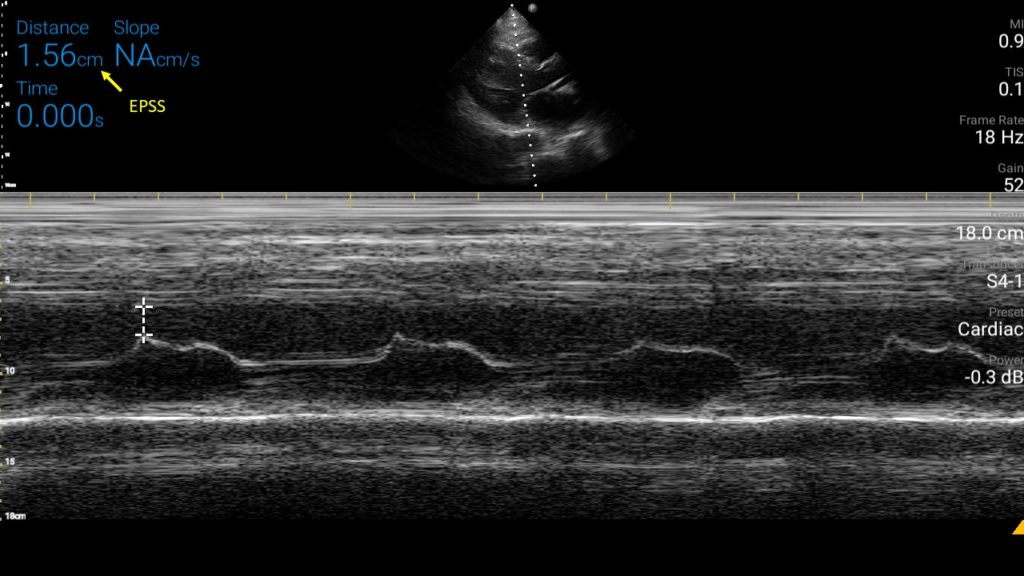
To obtain this, M-mode cursor is placed through the tips of mitral valve leaflets in PLAX view. As we saw with the IVC, the resultant tracing represents movement of the structures along the cursor plotted against time [Figure 5]. The black area in the middle would be the left ventricular cavity, within which the motion of the mitral valve leaflets can be seen as multiple ‘M’-shaped spikes. Anterior leaflet tracing appears prominent, while the posterior leaflet tracing is its mirror image but smaller. The first peak of the M is called the ’E-wave’ and represents early passive diastolic filling of LV. It almost touches the septum when the LV function is normal as we saw while discussing about the visual estimation of LV function. The second peak is called the ‘A-wave’ and represents active filling from atrial contraction. The white bar above this tracing corresponds to interventricular septum. Now the E-point septal separation (EPSS) is measured from the peak of E-wave to the septum.
An EPSS value more than 7 mm is generally considered as a marker of severe LV systolic dysfunction (LVEF <30%). In one study, The sensitivity and specificity of an EPSS measurement of > 7 mm for LVEF ≤ 30% were 100% and 51.6% respectively. Figure 6 demonstrates a case of high EPSS in a patient with systolic heart failure.
Limitations:
To obtain accurate EPSS, we need to obtain a good 2D PLAX view first. Off-axis (tilted) 2D image is probably the most common source of error. In addition, valvular pathologies such as mitral stenosis (limited motion of leaflets), aortic regurgitation (regurgitant jet impairs MV movement) may lead to falsely elevated EPSS. On the other hand, in patients with asymmetric septal hypertrophy and discrete proximal septal thickening (sigmoid septum) EPSS can be falsely low (= falsely reassuring while the function is low). Therefore, we need to take into consideration how the 2D and color Doppler images appear and then interpret together with EPSS.
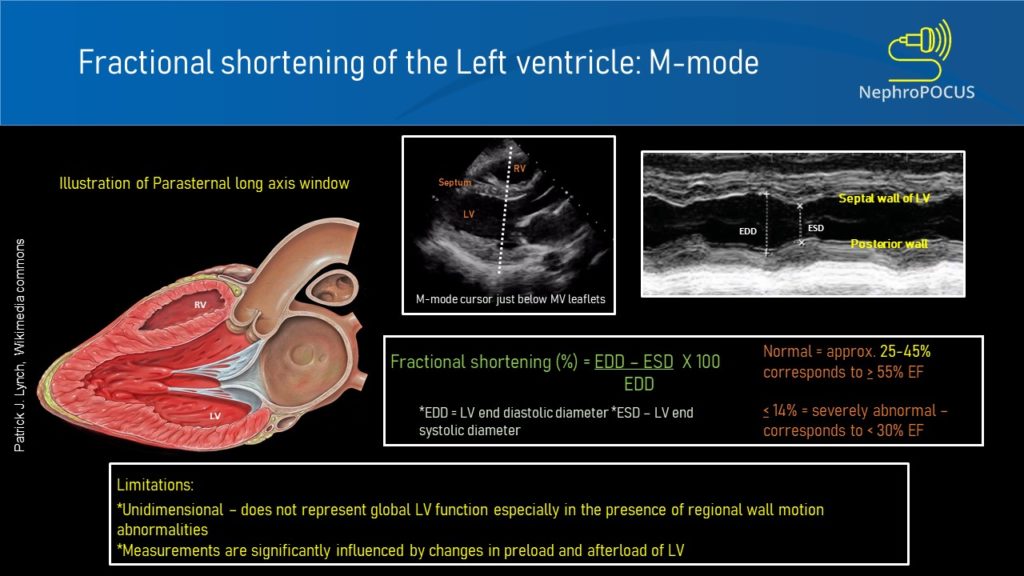
- Left ventricular fractional shortening:
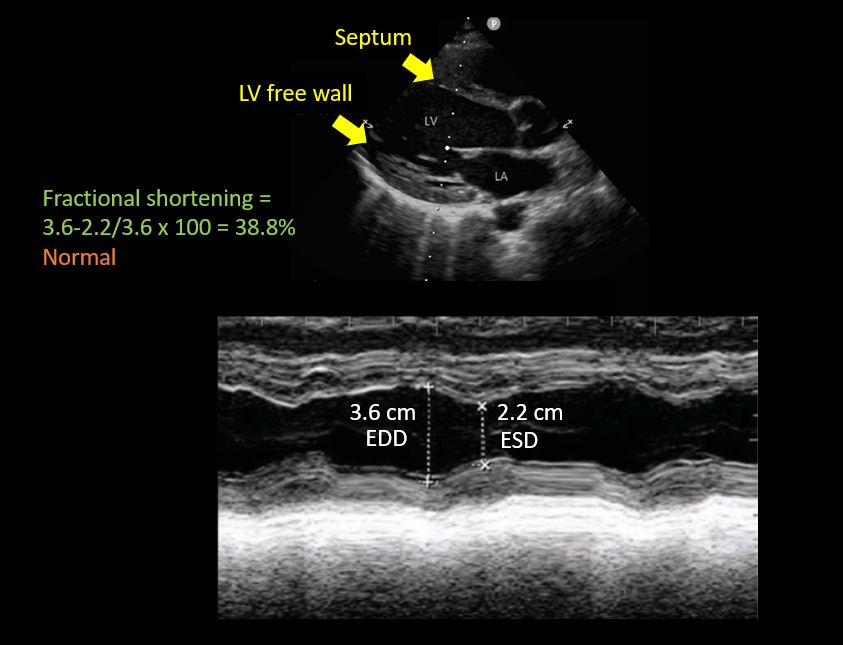
This is essentially a measure of how much the LV is shortening or the walls are getting closer during systole. The M-mode cursor is placed below the tips of mitral valve leaflets and the widest and narrowest diameters of LV cavity are measured like that of IVC ultrasound.
LV fractional shortening is calculated by the formula EDD-ESD/EDD x 100, similar to that of ejection fraction, the only difference being we are using diameters here instead of volumes (EDD = end diastolic diameter; ESD = end systolic diameter). Fractional shortening <27% for women and <25% for men are considered to indicate LV dysfunction (= less than 1/4th reduction in chamber size during systole is abnormal) [Figure 7]. Make sure you are not mistaking chordae tendinae or papillary muscles for LV free wall on the M-mode tracing. Carefully look at what parts of the 2D image are along the M-mode cursor.
Limitations:
As we are measuring this at one particular segment of the LV, fractional shortening may not correlate well with the actual ‘global’ LV function in the presence of regional wall motion abnormalities. In addition, sudden changes in afterload and preload can alter fractional shortening measurements.
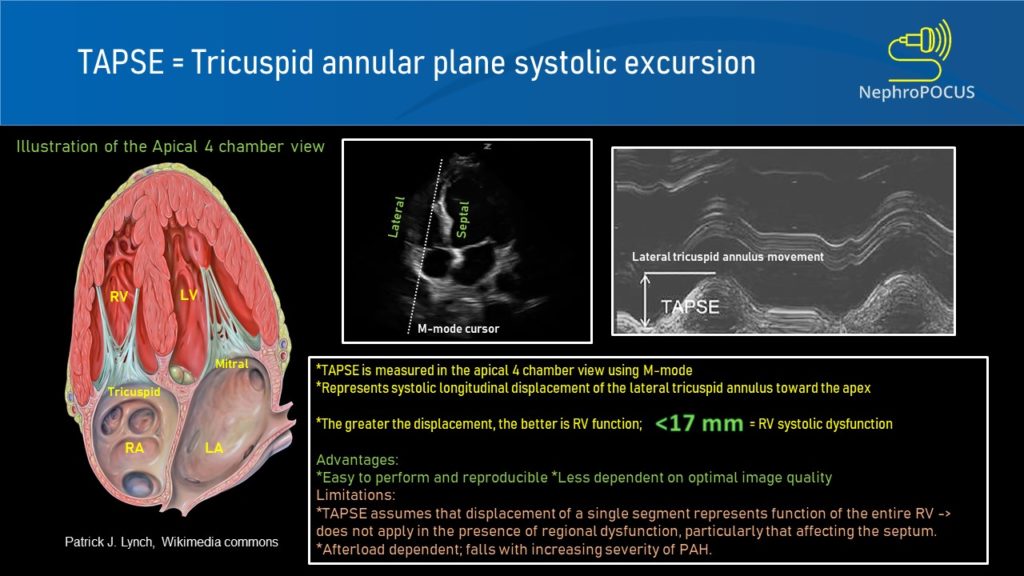
Right ventricular systolic function:
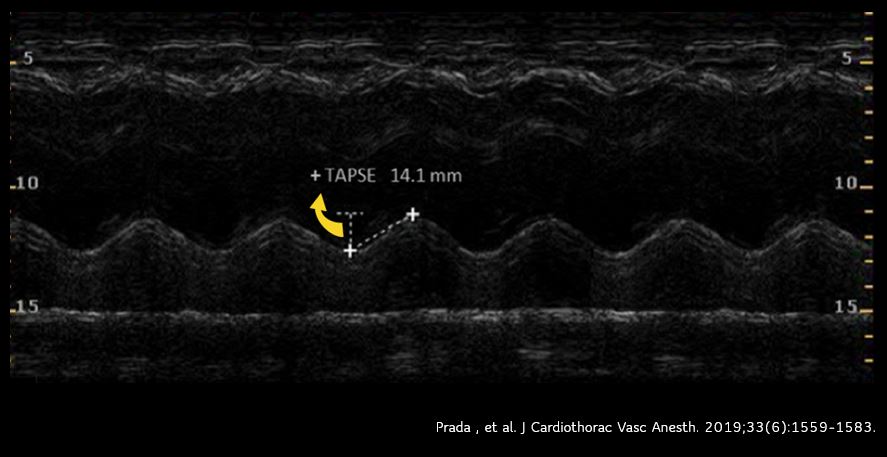
TAPSE (tricuspid annular plane excursion) is a M-mode measure used to assess RV systolic function. It measures the longitudinal movement of the lateral tricuspid valve annulus during systole. Assessment of longitudinal movement makes sense as the RV myocardial contraction in the longitudinal plane accounts for approximately 80% of the global RV systolic function. Interestingly, TAPSE closely correlates with RV ejection fraction measured by radionuclide angiography and is a predictor of survival in ICU patients as well as those with pulmonary hypertension.
To perform this, an apical 4 chamber view is obtained and the M-mode cursor is aligned through the right ventricular apex and the lateral tricuspid annulus. From the resultant tracing, the ‘vertical’ excursion of the lateral tricuspid annulus from end-diastole to end-systole is calculated (= TAPSE) [Figure 8]. In general, TAPSE less than 17 mm is suggestive of RV systolic dysfunction although there may be minor variations according to gender and body surface area. Figure 9 demonstrates low TAPSE in a patient with RV dysfunction.
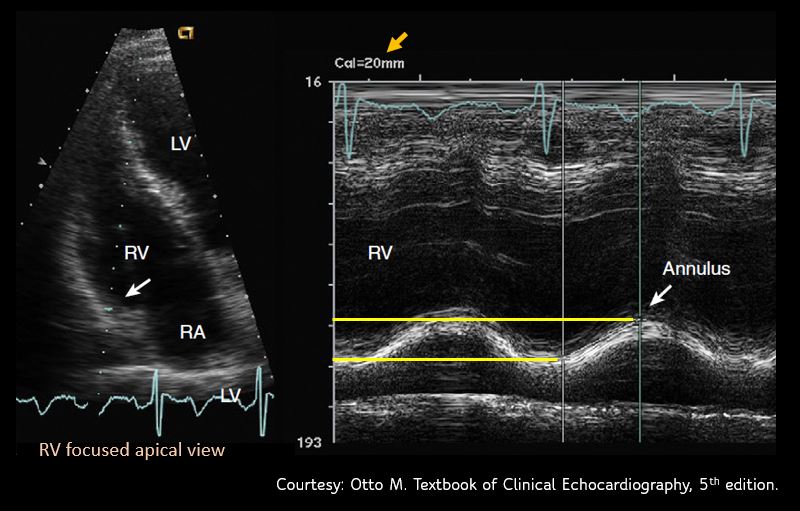
Sometimes, it might be necessary to obtain a RV focused apical view [Figure 10] for better alignment of the M-mode cursor. We can get this view by rotating the transducer slightly counterclockwise from the apical 4 chamber view till maximal RV area is seen.
Limitations:
TAPSE is angle and pre-load dependent. Moreover, as we are measuring only the lateral longitudinal motion, it may not be valid in the presence of regional RV wall motion abnormalities, particularly those affecting the septum. Furthermore, apical 4 chamber view is not always easy to obtain, especially in those with inflated lungs (mechanical ventilation, COPD etc.)
Following are the infographics summarizing EPSS, LV fractional shortening and TAPSE.
Figures 11, 12, 13
Abhilash Koratala, MD, FASN (@NephroP)
Medical College of Wisconsin