Why should nephrologists perform cardiac ultrasonography?
Cardiac POCUS, also known as focused cardiac ultrasound (FoCUS) is a valuable adjunct to physical examination in various clinical settings. Being able to evaluate cardiac pump function, chamber size, wall thickness, presence or absence of pericardial effusion and inferior vena cava size and collapsibility by the patients’ bedside enhances the quality of renal consults.
In addition, FoCUS can provide insights into transient changes in ventricular function and regional wall motion abnormalities that occur in patients receiving hemodialysis. This information can be used to tailor the amount of ultrafiltration according to individual patients’ cardiac status. In an interesting study of 254 asymptomatic dialysis patients, evaluation of myocardial contractility by using parameters within the scope of FoCUS has been shown to bear prognostic significance. As more nephrologists start incorporating POCUS into their practice, we can expect further data on patient outcomes to emerge.
What are the different views of the heart?
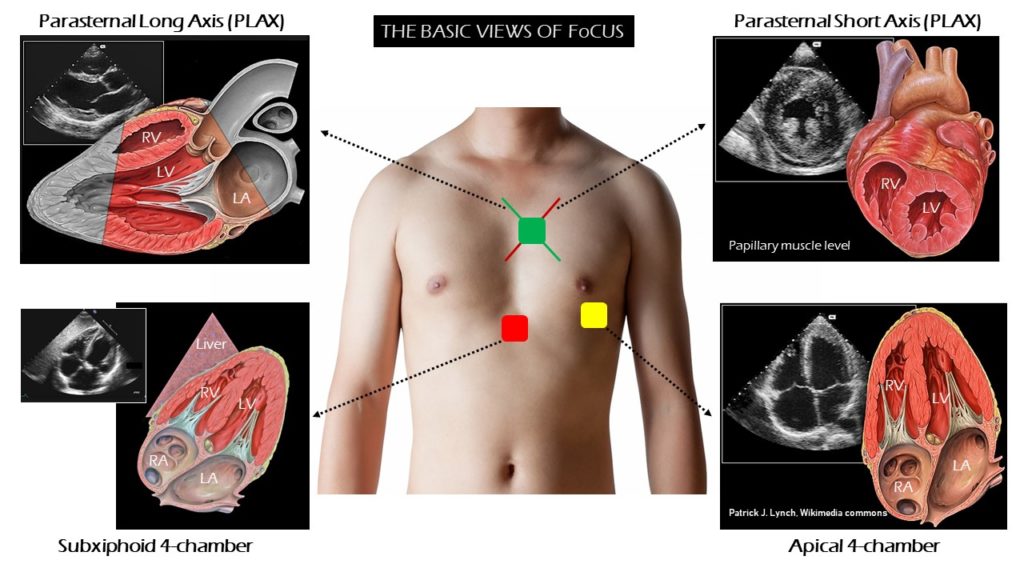
FoCUS consists of 4 basic views of the heart namely parasternal long- and short-axis views, the apical 4-chamber view, and the subxiphoid view, as described in the Rapid Ultrasound in Shock (RUSH) protocol (Figure 1).
The parasternal views are obtained with the probe positioned just left of the sternum at intercostal space 3 or 4. The apical 4-chamber view of the heart is obtained by placing the probe just below the nipple line at the point of maximal impulse of the heart. The subxiphoid 4-chamber view is obtained with the probe aimed up toward the left shoulder from a position just below the subxiphoid tip of the sternum.
It is important to have an idea of all these 4 views of the heart, as some views may not be well visualized depending on the individual patient’s body habitus and position, necessitating an alternative approach. The word ‘window’ is often used interchangeably with the cardiac views, though windows precisely refer to spaces between the ribs through which the views are obtained.
Parasternal long axis (PLAX) view is one of the easiest views to obtain and answers most of the questions encountered in day-to-day nephrology practice. The sonographic anatomy, image acquisition and key pathologies seen in this view are discussed below.
How is the exam performed?
The transducer or the probe:
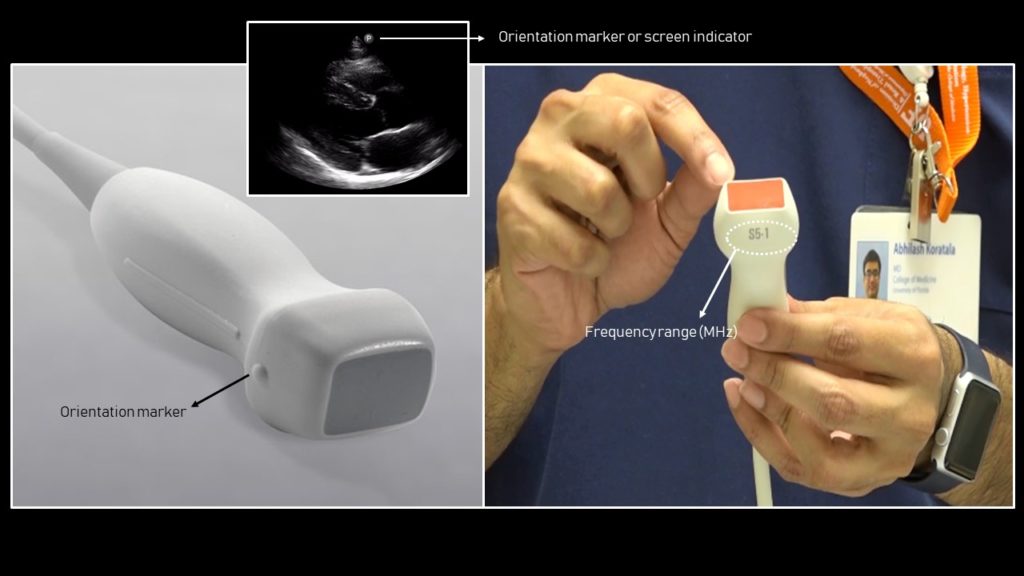
FoCUS is performed using a ‘phased array’ probe, which is a low frequency probe (= allows deeper penetration of sound waves) with a frequency range of 1 to 5 MHz. The foot print or the face of this transducer is small, allowing for it to be easily manipulated in between the intercostal spaces avoiding the rib shadows.
Image orientation:
Understanding image orientation is vital for accurate interpretation. Every ultrasound transducer has a probe marker along one side of its head. This marker can be a light, dot, or a linear ridge and corresponds to indicator on the screen, which is typically a dot or letter denoting the manufacturer. That means, when we say point the probe to the patient’s right shoulder while obtaining PLAX view, the part of the image on the side of the screen indicator is toward the patient’s right shoulder and the opposite side is toward the left hip. The part of the image that is closer to the probe is displayed on the top of the image, while that is farther is at the bottom.
A key difference to note when performing FoCUS compared to abdomen or lung POCUS is that in ‘cardiac mode’, the screen indicator is on the right of the screen (left in other modes) (Figure 2). If you forget to change the mode of the machine, the image will be flipped. Alternatively, direction of the probe indicator can be reversed to display the image appropriately (e.g. point to left hip instead of right shoulder to obtain PLAX view).
Patient set-up:
Patient position is supine in general. Left lateral decubitus position may be needed in some cases as it brings heart closer to the chest wall. If turning the patient is not possible, can put some pillows behind the right shoulder. Abduct the patient’s left arm when possible: this will widen the intercostal spaces and allow you to find a better window between the ribs.
Image acquisition:
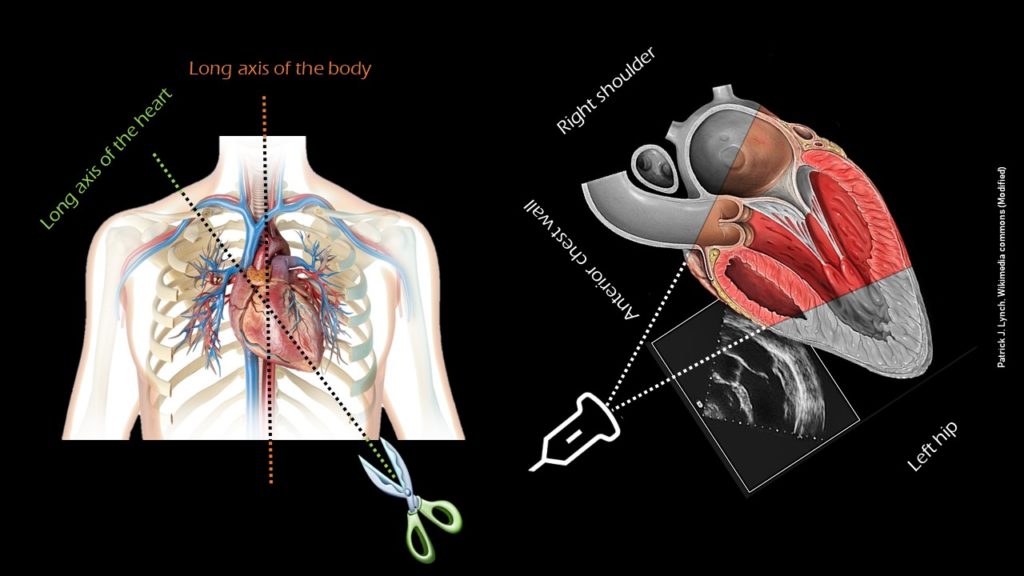
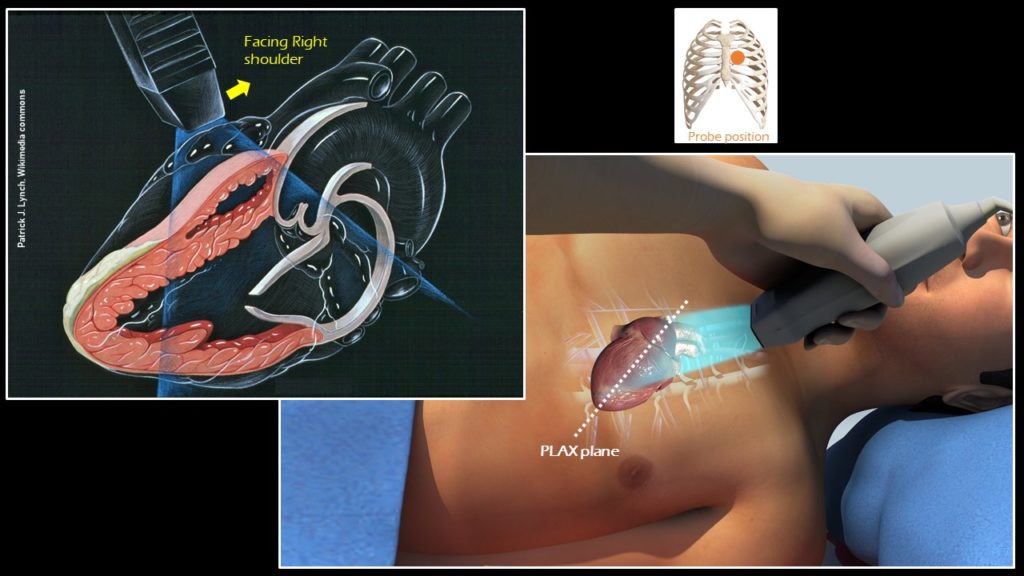
The heart is located between the lungs under the sternum with the apex pointing slightly to the left. The longitudinal axis of the body is vertical, while the heart is located at an angle from the apex in the lower left portion of the chest cavity to the right shoulder (Figure 3). The PLAX view is obtained by placing the transducer to the left of the sternum in 3rd or 4th intercostal space with the orientation marker toward patient’s right shoulder or 10 o’ clock position, which is essentially the ‘long axis’ of the heart (Figure 4).
Anatomy of the PLAX view:
In a technically ‘good’ PLAX view, both the mitral valve and the aortic valve will be clearly seen and will be roughly in the center of the image, stacked on top of each other. The base of the left ventricle (LV), but not the apex, will be visible. The right ventricular outflow tract (RVOT) will be seen on the top of the image. Note that the right ventricle has noticeably thinner and smaller walls compared to the LV. The right atrium (RA) is not visible in this view. On the right, the left atrium (LA), aorta and RVOT each should roughly take up one-third of the image. Pericardium appears as a bright border and the descending thoracic aorta is visible at the bottom of the image, as a circle outside the LA (Figures 5 and 6).
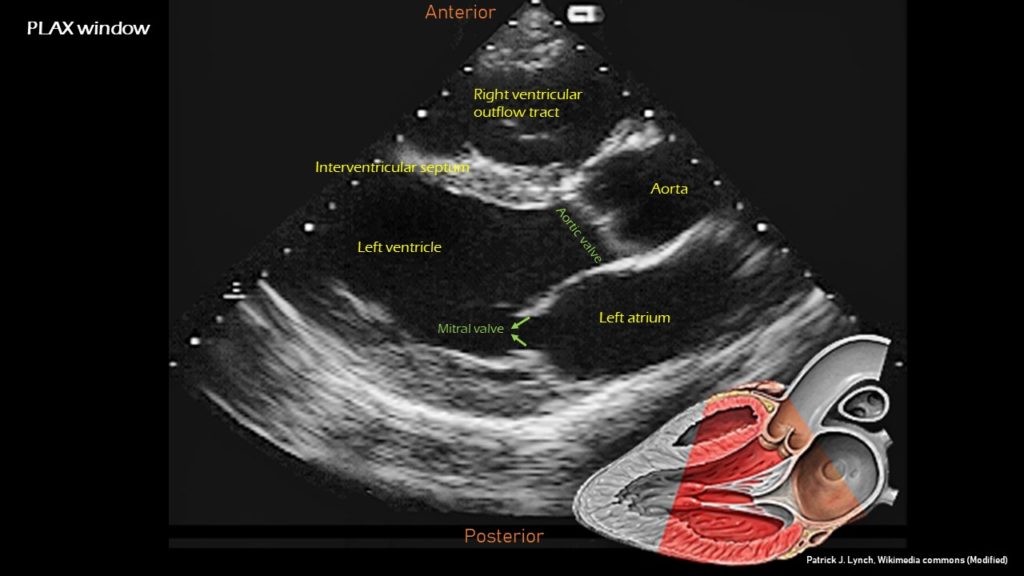
Image optimization:
If the image is oblique, try moving the transducer one intercostal space higher. If the valves are off-center, tilt the transducer away from the sternum. In addition, make sure the depth is adequate, usually around 12-16 cm. If the depth insufficient, the image might not display all of the structures that need to be evaluated.
How do we qualitatively assess the left ventricular function using PLAX view?
Visual estimation of the LV function or the ‘eye ball’ method can provide reliable and reasonably accurate information when performed by experienced user. Optimal image quality is necessary to avoid erogenous interpretation. Eye ball method essentially involves assessment of LV function using wall motion and comparison of the chamber size between systole and diastole.
Wall motion constitutes both thickening and inward motion of the endocardium during systole. As walls of the LV thicken and move toward each other during systole, the LV chamber gets smaller. In patients with depressed LV function, both wall thickening and inward motion during systole are reduced.
In addition, pay attention to the movement of the mitral valve, mainly the anterior leaflet (the top one). Normally, this leaflet almost touches the interventricular septum with each heartbeat. If the ejection fraction is low, reduced stroke volume results in decreased blood flow through the mitral valve and it does not open maximally, increasing the distance between the septum and anterior leaflet. Figure 7 shows PLAX views in patients with normal, moderately reduced and severely reduced LV function respectively. Remember to interpret everything in the appropriate clinical context. For example, patients with hypertrophic cardiomyopathy have thickened walls to begin with and similarly, patients with a history of myocardial infarction can have pre-existing regional wall motion abnormalities.
M-mode (Motion mode) can be used as an adjunct to the eye ball method to semi quantitatively estimate LV ejection fraction. This will be discussed in further posts.
How do we evaluate for pericardial effusion?
Pericardial effusion appears as an anechoic or echo-free space between the two layers of the pericardium. PLAX and subxiphoid 4-chamber views are considered to be the best views for detection of pericardial effusion.
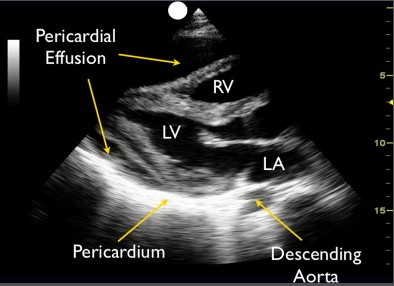
In PLAX, a small effusion can easily be seen either anterior to the RVOT or posterior to the LV posterior wall. Quantitative assessment of the effusion can be helpful for appropriate initial management as well as follow up. The quantity is estimated as trivial (seen only in systole), mild (the echo-free space is <10 mm at its greatest width), moderate (10 to 20 mm), and severe (>20 mm). This is particularly useful when you want to see if your patient with suspected uremic pericardial effusion is improving with dialysis or not. Figure 8 illustrates a large pericardial effusion seen in PLAX view.
In addition to estimating the size of the effusion, one should pay special attention to the presence of tamponade physiology, which essentially means that the effusion is compressing the cardiac chambers and restricting them from normal filling. The highly specific finding for tamponade that can be visualized in PLAX view is diastolic right ventricular collapse. A simultaneous finding of plethoric inferior vena cava with minimal respiratory variation is also highly suggestive. Systolic right atrial collapse is the earliest sign of tamponade, which can be noted in apical and subxiphoid 4-chamber views. Remember that RA is not visible in the PLAX view.
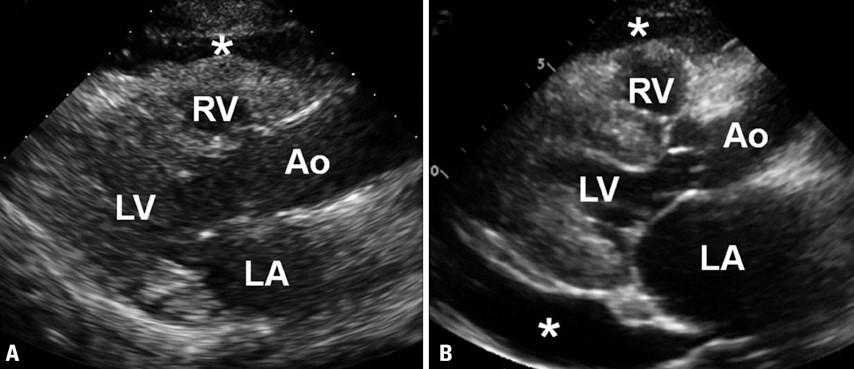
Another important detail to pay attention is that both pericardial and pleural effusions can be seen in PLAX view and mistaking one for the other can lead to inappropriate management. The descending thoracic aorta is the anatomical landmark to differentiate between a pericardial and a pleural effusion in this view. Effusion anterior to the descending aorta (toward the top of the screen) is pericardial effusion and the fluid at or posterior to it is likely pleural effusion. Figure 9 illustrates the presence of both pericardial and pleural effusions in PLAX view.

Mistaking epicardial fat pad for pericardial effusion is another common pitfall. In contrast to an anechoic effusion, a fat pad will appear heterogeneous and described as having a ‘stippled appearance’. It will often be distributed in the ‘anterior’ atrioventricular groove. With exception of loculated effusion, free pericardial fluid accumulates in the dependent region, usually posterior to LV in PLAX, in supine position (Figure 10). Moreover, instead of seeming to compete with the cardiac chambers for space within the pericardial sac, the fat pad moves in conjunction with the myocardium during the cardiac cycle.
Abhilash Koratala MD FASN (@NephroP)

Erogenous interpretation sounds intriguing…
Love it ……well explained with views…. appreciable
as long as these are cited appropriately.
You do an excellent job putting together very nice visuals to help explain important POCUS concepts. May I please have your permission to use a couple of the above figures in some of my PowerPoint slides that I will use to help teach POCUS to medical students, Internal Medicine residents, and Hospitalists? My slides will be used for educational purposes only with the goal of teaching POCUS to others and encouraging the use of POCUS within the field of Internal Medicine. Of course, I will be sure to keep the original credit and cite the renal fellow network for any figures I use in my slides. Thank you so much for your consideration and for all you are doing within the POCUS community!
Dear Rich,
I have gathered those illustrations from Wikimedia commons and put together as a Figure (credited the artist, Patrick Lynch). Its fine to use as long as you keep the original credit and cite renal fellow network.
Thanks,
Abhilash
Hi, recently stumbled upon this article while google image searching for a nice diagram depicting the essential cardiac views. Would you mind if I used the image in Figure 1 in an upcoming article as long as I cite/reference it appropriately? Thanks in advance!
Thank you for the article.
it is superb
Thank you for putting this up. I found it very helpful .
THANK YOU for this article!
Nice and simple explanation we need to explain the other views
Cool post!!! Looking foward next one!!
Great
Nice article and Keep me updated