Last month we focused on introducing the Parasternal Short Axis View (PSAX). Now we turn our attention to some of the must-know abnormalities for the nephrologist in this view.
Left ventricular function
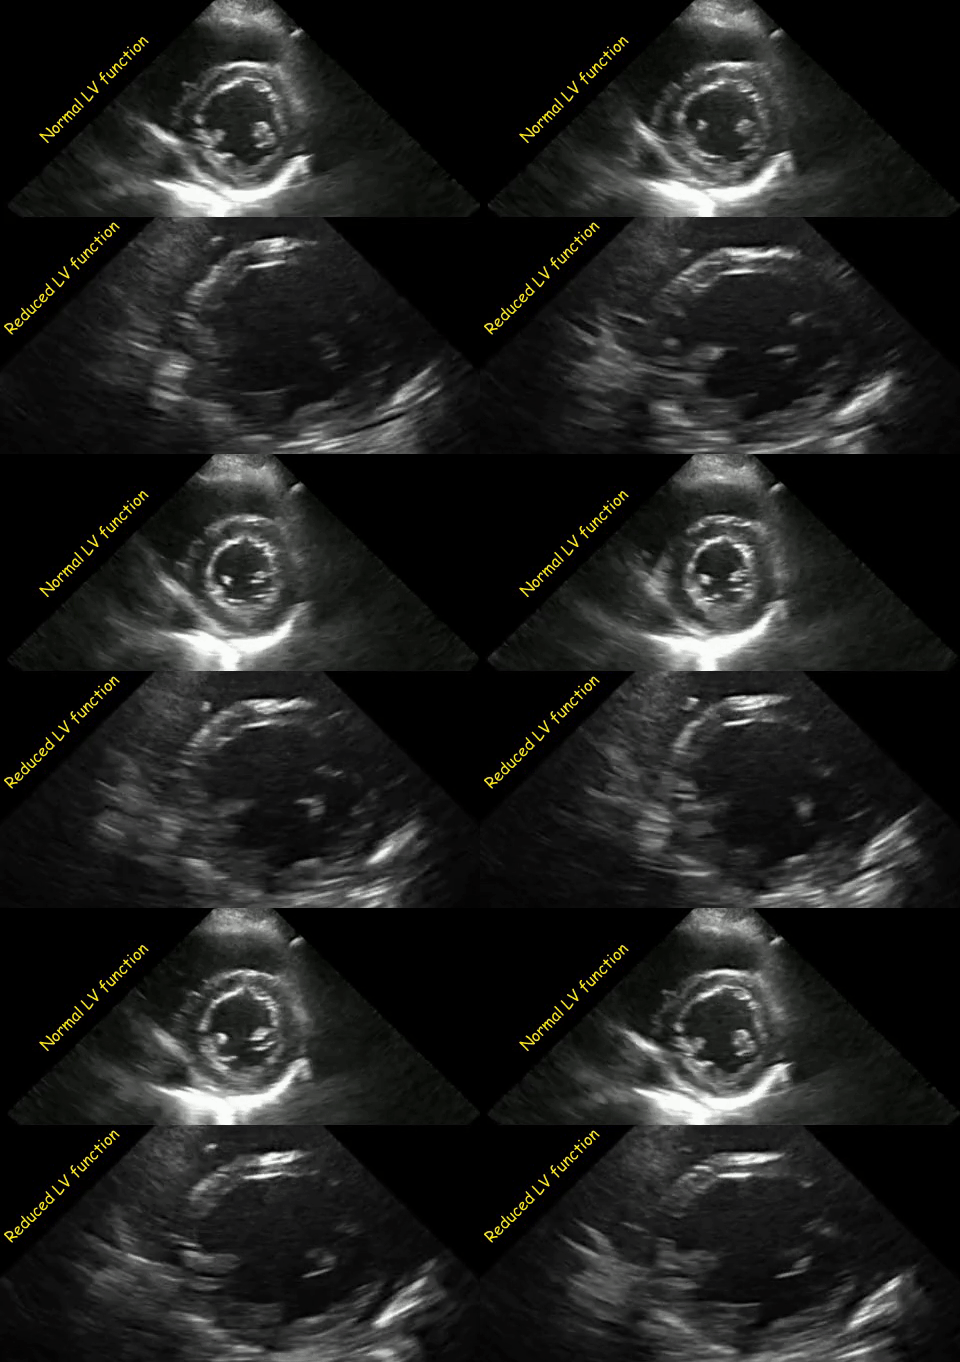
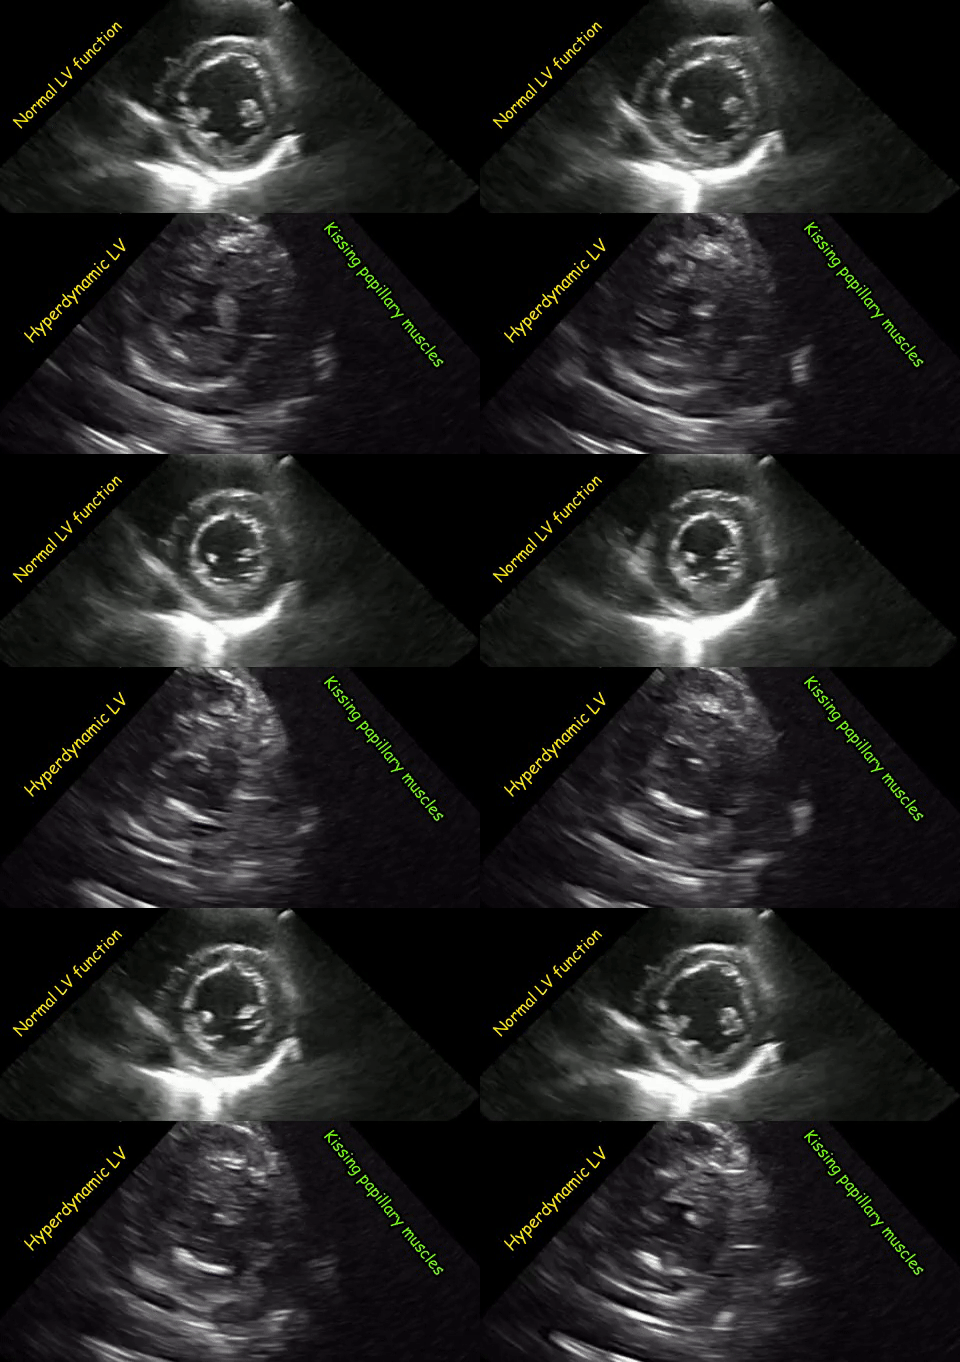
As mentioned in the previous post, visual estimation of the left ventricular systolic function involves observing the wall motion and comparing the ventricular cavity size in systole and diastole. Wall motion includes both thickening and inward motion during contraction.
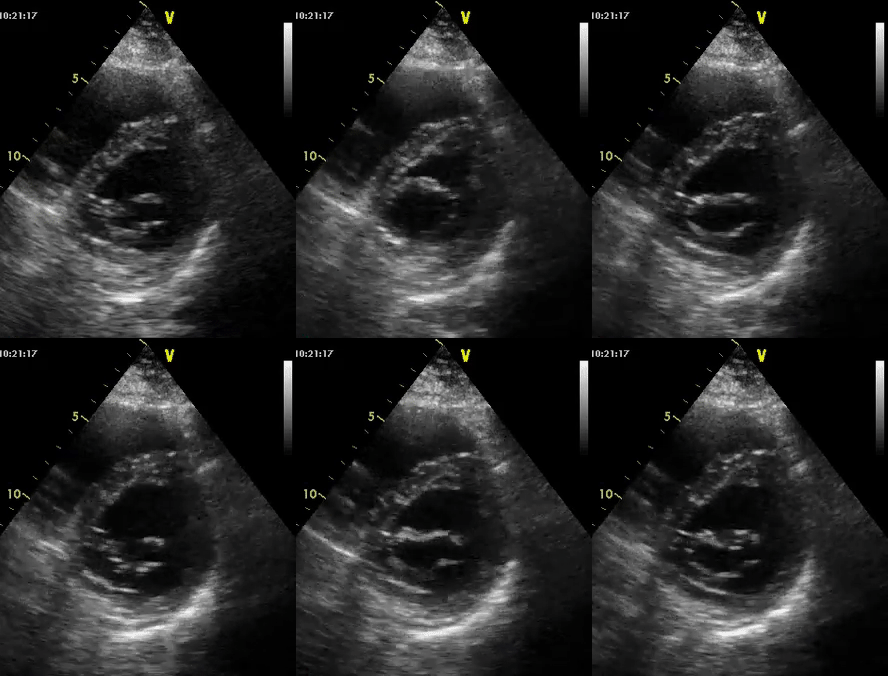
Figure 1 demonstrates a case of reduced left ventricular function. Similarly, Figure 2 illustrates a case of severely depressed left ventricular function. Note that the ventricle is barely moving with heart beat. Figure 3 demonstrates hyperdynamic left ventricle in a patient with hypovolemia. Note that the wall thickening and inward motion almost obliterate the left ventricular cavity in systole and the papillary muscles appear to be kissing each other. This ‘eye ball’ estimation of left ventricular function tends to be fairly accurate when performed by experienced users.

The D-sign
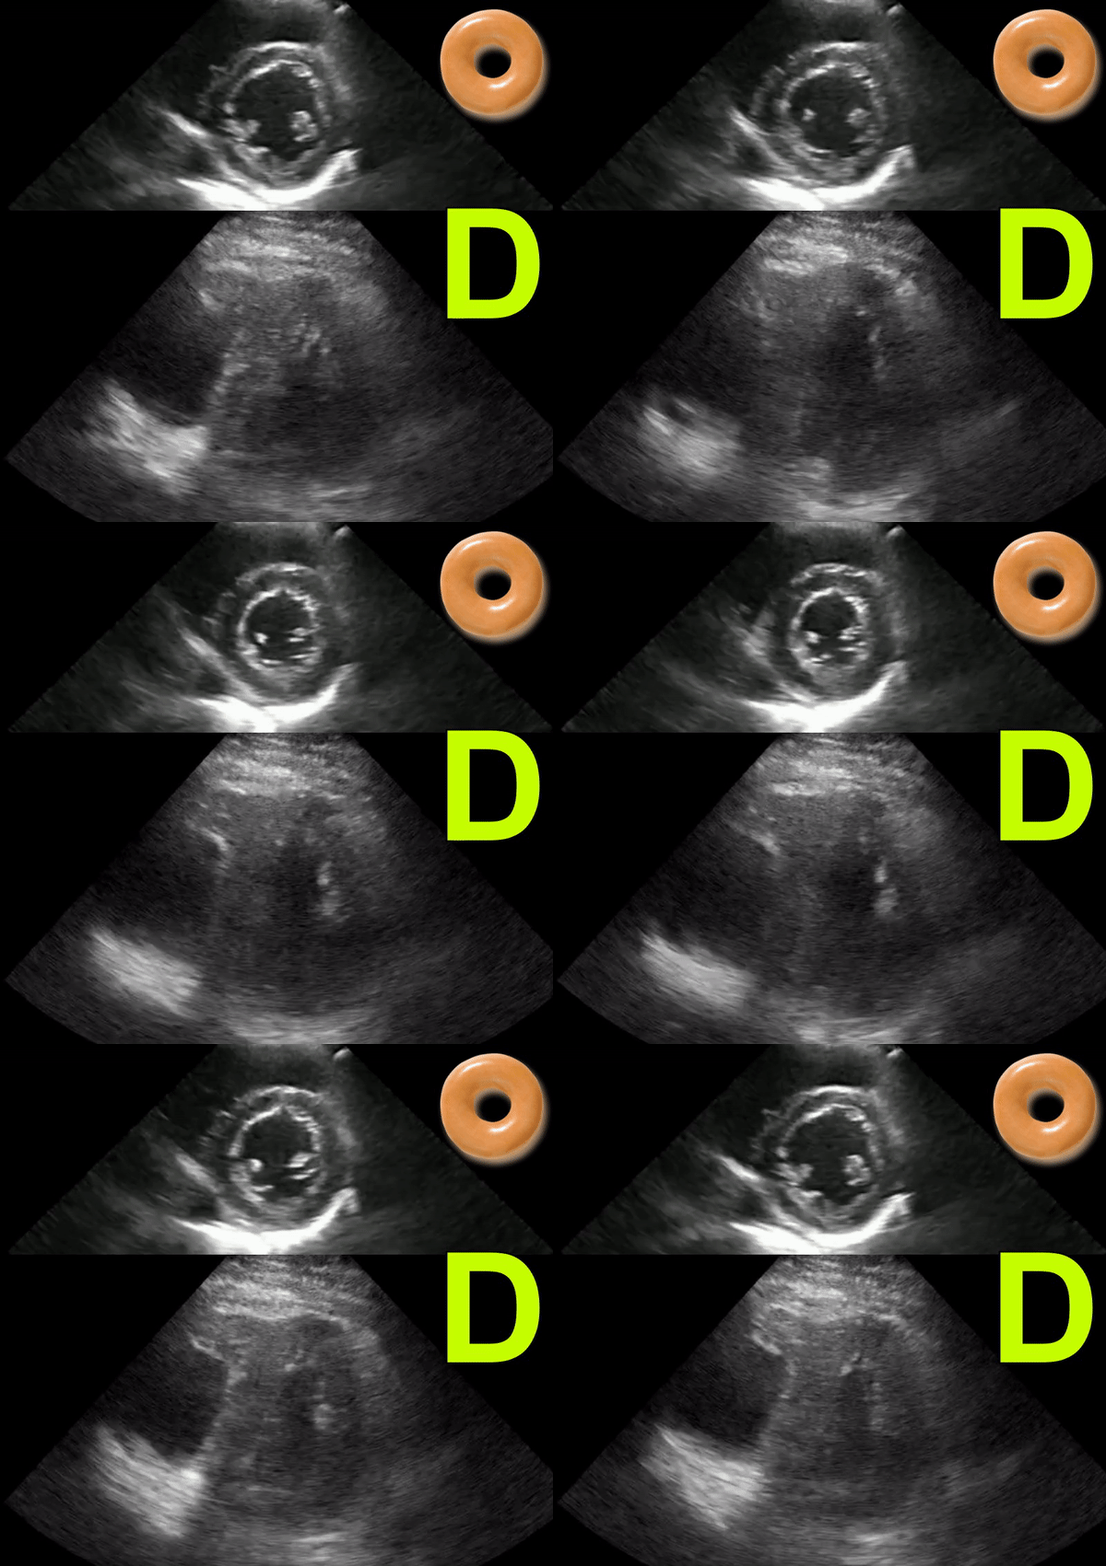
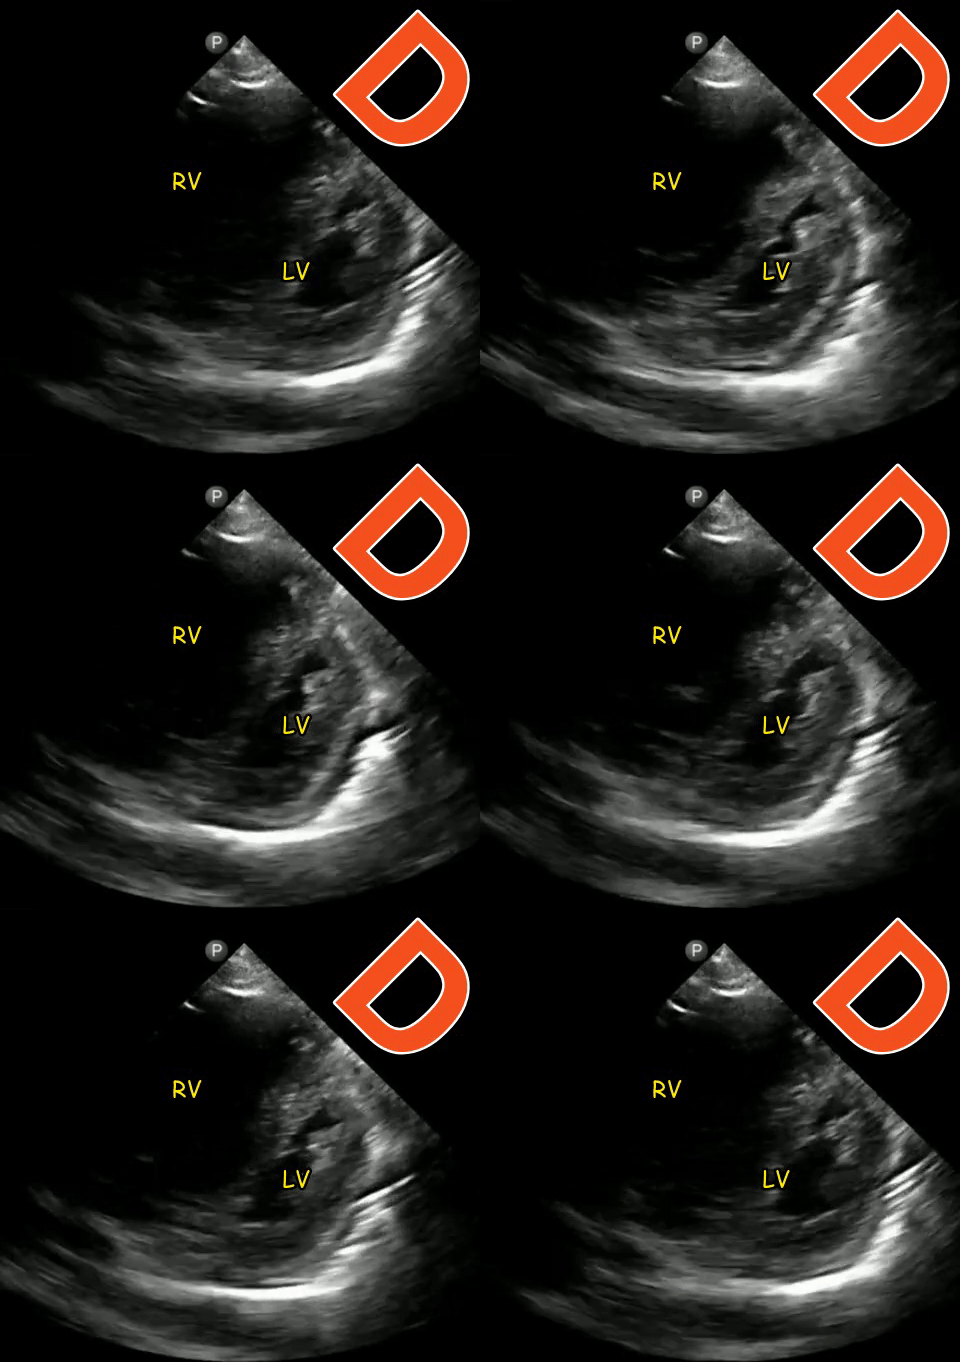
When the left ventricle assumes the shape of letter ‘D’ instead of its normal circular donut-like appearance, it is called the D-sign. It happens when the early diastolic right ventricular pressure exceeds that of the left ventricle and represents right ventricular pressure overload. It can happen in cases of acute right ventricular failure such as pulmonary embolism, ARDS etc. or chronic pulmonary hypertension in which case, the right ventricle appears much bigger than the left. As mentioned in the previous post, beware of the false D-sign due to inappropriate probe positioning. Figure 4 demonstrates this sign in a patient with acute pulmonary embolism (Original image: Dr. Therese Mead). Figure 5 was obtained from a patient with acute pulmonary embolism on top of chronic pulmonary fibrosis. Note the right ventricular dilatation reflecting chronic pathology. However, the patient was hypoxic and had lower extremity deep vein thrombosis prompting work up for acute pathology (Original image: Dr. Robert Inga).
Pericardial effusion
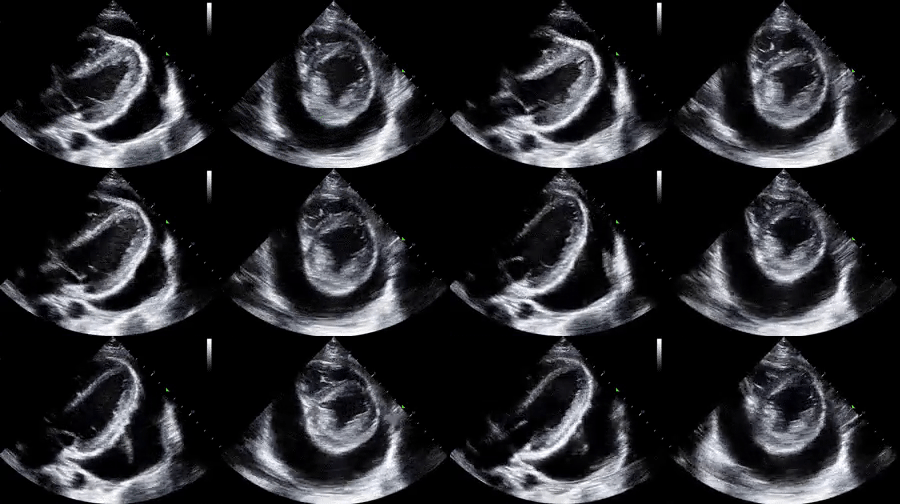
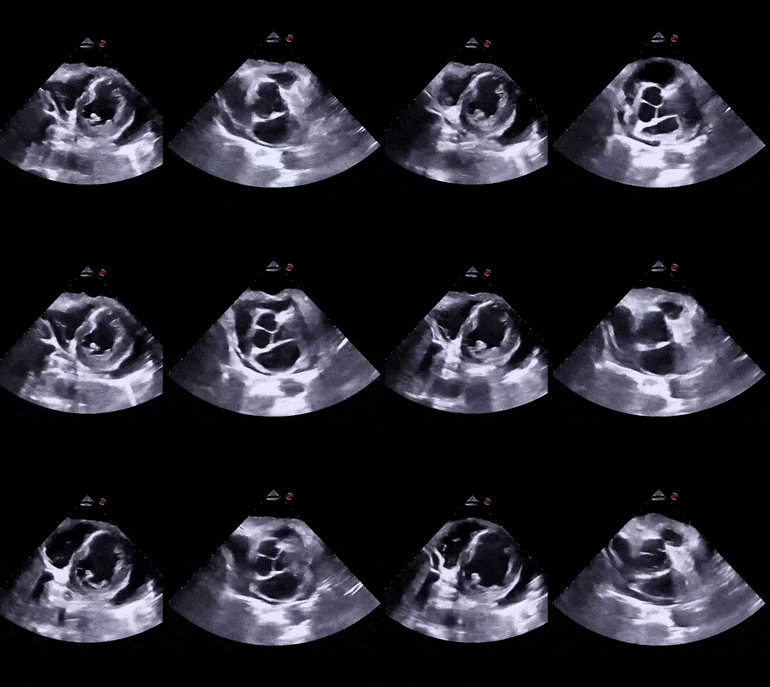
PSAX is also a good view for evaluation of pericardial effusion. As mentioned in the previous post, pericardial effusion appears as an anechoic or echo-free space between the two layers of the bright pericardium. When there is tamponade physiology, diastolic right ventricular collapse may be visualized in this view. Aortic valve level may also show right atrial collapse. Figure 6 demonstrates PSAX papillary muscle view with moderate-severe pericardial effusion. Subxiphoid view is shown on the left for comparison (Image courtesy: Dr. Sam Ghali). Figure 7 is another example of moderate-severe pericardial effusion in PSAX view, papillary muscle and aortic valve levels. Note the right sided chamber collapse (Image courtesy: Dr. Gonzalo Garcia-Casasola).
Other common abnormalities
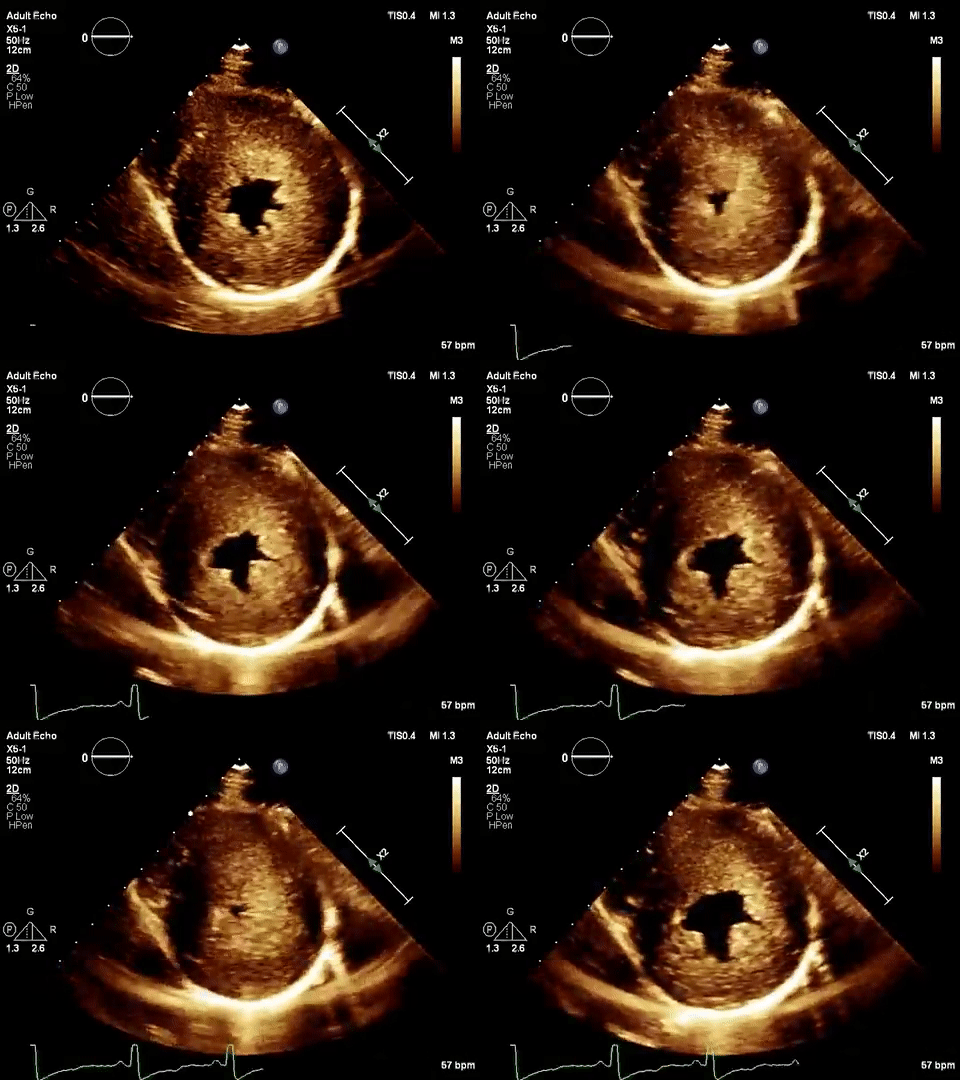
Several other pathologies may be encountered during focused echocardiography. While it is not expected of the physician performing POCUS to know everything, it is important to recognize when something isn’t right and promptly request a formal echocardiogram. Following are some of the rarely encountered pathologies. Figure 8 demonstrates severe left ventricular hypertrophy in a patient with apical hypertrophic obstructive cardiomyopathy (Image courtesy: European Society of Cardiology). Figure 9 shows two echogenic structures in the PSAX view next to left ventricle in a patient with pericardial effusion. Further imaging revealed severe biatrial enlargement in this patient with mitral regurgitation and those structures represent enlarged left atrial appendages (Image courtesy: Dr. Virginia Zarama). Figure 10 illustrates atrial flutter with AV block in PSAX view. Closely observe the opening of mitral valve and left ventricular contraction (Image courtesy: Dr. Ivan Stankovic).

Abhilash Koratala, MD FASN


Excellent post. Thank you for putting this together.