Eduardo R Argaiz @ArgaizR, National Institute of Medical Science and Nutrition Salvador Zubiran, Mexico
It is well known that congestion is the primary reason for hospitalization in patients with acute heart failure and an important target for therapy. Similarly, positive fluid balance is an independent predictor of mortality even after correcting for comorbidity and disease severity in patients with acute kidney injury. In this context, point of care ultrasonography (POCUS) serves as a valuable adjunct to physical examination to assess fluid volume status. POCUS can be used to directly visualize central veins and estimate compliance (e.g., IVC size and collapsibility index). Adding organ Doppler (hepatic, renal) to your regular POCUS exam will help you detect altered blood flow secondary to venous congestion.
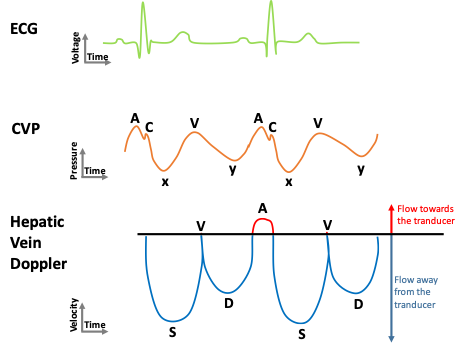
First, let us talk about the central venous pressure (CVP) waveform.
A normal CVP waveform has three positive components (A, C and V waves) and two negative deflections (X and Y descents) caused by events that occur during the cardiac cycle in the following order: (Figure 1)
A wave: Right atrial systole
C wave: Isovolumic contraction
x descent: Right ventricular systole (downward pull on tricuspid valve by papillary muscles)
V wave: Passive right atrial filling
y descent: Right ventricular diastole
Normal Hepatic Vein Doppler Waveform
Changes in the right atrial pressure determine the pattern of flow that occurs in veins located in the immediate vicinity such as the hepatic veins. Thus, the normal flow in the hepatic veins is pulsatile. It usually consists of two antegrade (below the baseline in this case) waves: a larger systolic (S) wave and a smaller diastolic (D) wave (corresponding to x and y descents of the CVP waveform); And two retrograde waves (A and V) (corresponding to A and V waves of the CVP waveform) (Figure 1).
Hepatic Vein Doppler Waveform: Alterations
Knowing in what phase of the cardiac cycle the normal waves are produced can help understand common alterations. For example, altered right ventricular systolic function or tricuspid regurgitation will lead to decreased amplitude of S wave, S wave reversal can be seen in severe regurgitation; increased right atrial volume with decreased compliance will produce large A and V waves, and RV relaxation abnormalities will result in decreased D wave amplitude (Figure 2).

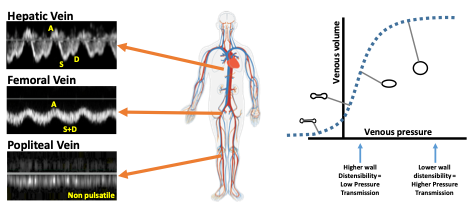
Transmission of pressure across the venous vascular tree
Positive pressure waves generated in the right atrium (A wave, V wave or reversed S wave) will transmit backwards into the venous vascular tree. In normal subjects, veins are highly compliant, and energy will be dissipated secondary to distension of the venous walls. Thus, pulsatility gets dissipated as you get further from the right heart (Figure 3). Two factors can contribute to increased venous pulsatility:
- Increased right atrial pressure
- Decreased venous compliance
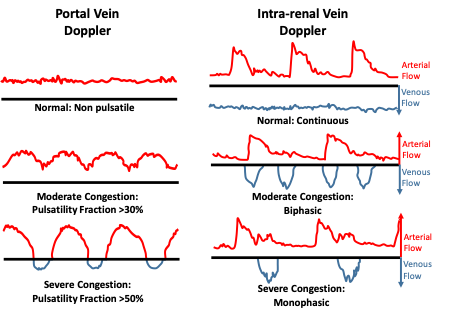
Portal Vein and Intra-renal venous Doppler
Increasing severity of venous congestion lead to alterations in abdominal organ blood flow; These alterations have been linked to organ injury and adverse outcomes. In the portal vein, this manifests as increased pulsatility fraction (PF = 100 * [(Vmax-Vmin)/Vmax]) while intra-renal veins (arcuate or inter-lobar) will show interrupted blood flow. Given the small arteries and veins of the kidney run parallel to each other, it is frequent to observe both arterial and venous flow on the same tracing (Figure 4). Identifying these patterns in patients with target organ injury (e.g. Congestive AKI) is important because decongestive therapy is likely to improve organ function.
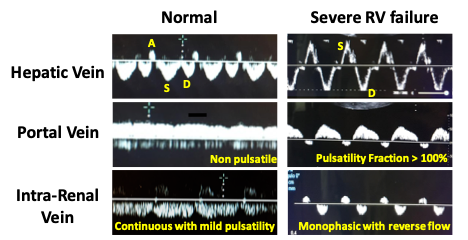
Here is a real-life example of normal and abnormal venous waveforms (figure 5).
Potential Pitfalls:
Portal Vein: Increased pulsatility without congestion can be seen on tall healthy subjects. Patients with cirrhosis of NAFLD may display blunted pulsatility even in the presence of venous congestion given impedance to flow in the liver.
Renal Vein: More time consuming and harder to obtain. Might be impacted by renal parenchymal disease.
Given these limitations:
- Complete evaluation of venous congestion should always begin with the IVC.
- Venous Doppler assessment should only be pursued in the presence of a plethoric IVC in order to increase specificity.
- Performing a multi-organ assessment of venous congestion will increase diagnostic accuracy together with focused cardiac and lung ultrasound.
How to perform this assessment?
Here is a brief video tutorial on how to obtain hepatic and portal vein Doppler waveforms. A second video on how to obtain intra-renal veins can be found here.
Reviewed and edited by: Abhilash Koratala, Sam Kant

Informative review