Last week we began with an introduction to lung ultrasound to equip us during the times of COVID-19. This week we dive into specific nuances that will aid our assessment of patients with COVID.
Lung ultrasound for COVID-19
Ultrasound has several advantages in this context:
- It is safe, no radiation exposure
- LUS (even basic FoCUS) does not need sophisticated equipment; hand-held ultrasound devices work well
- Can be performed at the bedside (expedites management) and repeated as necessary
- Findings are comparable to that of CT scan (based on COVID experience as well as previously published literature)
- Limits patient transport to CT and the need to obtain multiple chest radiographs = reduced risk of exposure to health-care workers
While the sonographic findings seen in COVID-19 are similar to that of other viral or atypical bacterial etiologies, following features are considered to be characteristic (not ‘specific’) based on the current data.
| Lung ultrasound findings in COVID-19 |
| B-lines: Focal, multi-focal or confluent |
| Thickened, irregular pleural line |
| Consolidations: Usually small multi-focal, occasionally translobar |
| Pleural effusions: uncommon, small if present |
| A-line pattern reappears during recovery |
| *Pay particular attention to lateral and posterior scan zones |
Now let us talk about some of these findings briefly.
B-lines:
As mentioned above, B-lines can be cardiogenic or pneumogenic in origin. As opposed to cardiogenic pulmonary edema, where B-lines are more uniformly distributed, B-lines in pneumonia tend to be multifocal with ‘skip areas’ in between (= areas of normal lung). Of note, presence of focal B-lines is an important feature in early/mild disease. In addition, B-lines are often ‘confluent’ or ‘coalescent’ (= difficult to count individually = white lung) indicating severe loss of lung aeration. Figure 1 demonstrates confluent B-lines, while Figure 2 shows both confluent B-lines and adjacent uninvolved lung (skip area with A-lines).
Irregular and thickened pleural line:
Irregular pleura, that is pleural line with broken or ‘chopped up’ appearance is frequently seen in this setting indicating there are subpleural consolidations. Figure 3 demonstrates an irregular pleural line obtained with a linear probe. Compare it to Figure 1. Also, thick pleura (>2-3 mm) seems to be a common accompaniment [Figure 4].
Consolidations:
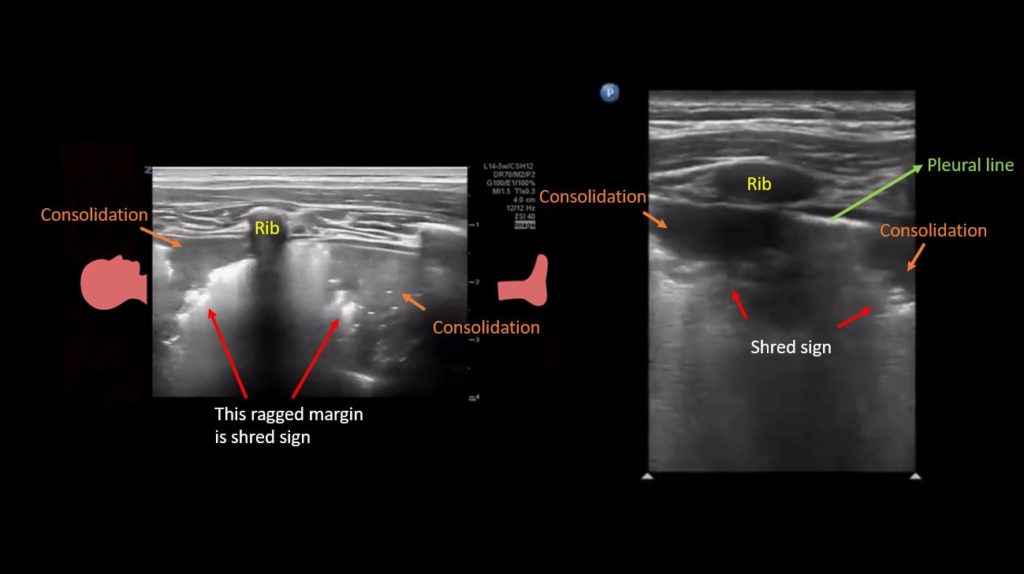
Patchy subpleural consolidations are more common though translobar consolidations may be seen occasionally. Once you note irregular pleural line using curvilinear or phased array probe, switch to linear probe (or corresponding preset if using a single-probe device such as Butterfly®) to see these small consolidations better. Patchy consolidations may or may not demonstrate air bronchograms but are separated from the surrounding aerated lung by an irregular margin, like a torn paper, which is called the ‘shred sign’. Figures 5 and 6 are excellent examples of subpleural consolidations and shred sign, obtained using linear probe. Figure 7 is a labeled image of these. Note that typical hepatization pattern is not always seen and they can appear as just anechoic or hypoechoic areas [Figure 6].
What about Acute respiratory distress syndrome (ARDS)?
For the diagnosis of ARDS, lung ultrasound is highly sensitive, specific, as well as reproducible. It can be considered a reasonable alternative to chest radiograph and even CT scan. In addition, it can be used to monitor response to prone positioning (as indicated by improved aeration in posterior zones) and predict the risk of extubation failure. Sonographic findings in ARDS are essentially the same as above but widespread and bilateral. Sometimes, it just appears like diffuse cardiogenic pulmonary edema.
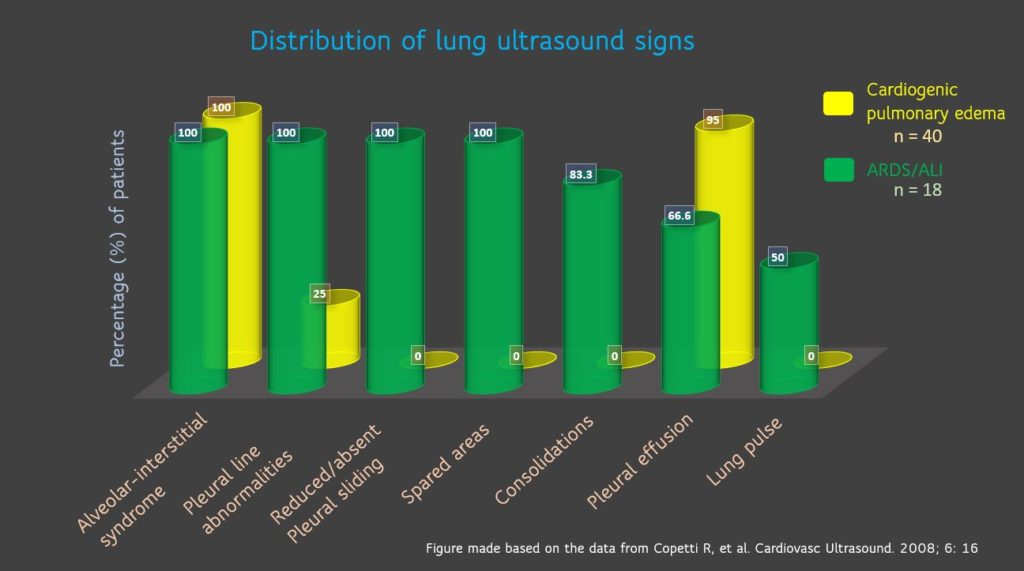
Copetti, et al. have characterized various pleuroparenchymal patterns to differentiate ARDS from cardiogenic pulmonary edema. Figure 8 summarizes these findings. Interestingly, 100% of the ARDS patients had either reduced or absent lung sliding. It is important to pay attention to this because absent lung sliding should not be confused with pneumothorax. These patients are typically on higher PEEP values, which diminishes the lung sliding. Always remember that the area of pneumothorax would NOT have B-lines (has A-lines) or the lung pulse. Lung pulse indicates the transmission of cardiac vibrations to the pleura [Figure 9], which is better seen when the sliding is diminished in poorly aerated lung (as in ARDS) but not in pneumothorax. This phenomenon is also seen with unilateral intubation (e.g. seen in left lung when right lung is intubated), therefore, interpretation in the appropriate clinical context is important.
A real case:
Dr. Gonzalo Garcia-Casasola, Chair of Internal Medicine & Emergency Department at the Hospital Universitario Infanta Cristina, Madrid is currently recovering from COVID-19 infection. He has graciously shared his LUS images with us.
Figure 10 is an illustrative image of subpleural consolidation (arrow) and B-lines in the left lower lung.
Figure 11 Lower left and right lung comparison between days 2 and 3 of diagnosis. Note confluent B-lines, small subpleural consolidation (day 2 images). Right lung from day 3 shows A-lines suggestive of improvement. Of note, he was treated with hydroxychloroquine.
Figure 12: Right and left posterior-lower zones on day 4: A-lines in the right lung (sustained improvement) and confluent B-lines with irregular pleural line on the left.

Figure 13 Comparison between days 4 and 6 left posterior-lower zone. Confluent B-lines in both images, pleural line irregularity seems to be better on day 6. Pleural thickening can be better appreciated. Clinically, there was no fever and oxygen saturation normalized by day 6.
Lung ultrasound for triage:
LUS can be used to detect lung lesions in patients presenting with mild symptoms and apparently negative chest X-ray, which makes it a good screening tool. Health care providers in Italy have found this approach valuable in risk stratifying the patients amid COVID-19 crisis. More triage protocols using LUS are being developed. In dialysis units, nephrologists should consider using LUS as a screening tool instead of CT scan to expedite care and conserve resources. CT should be reserved for those with equivocal findings or underlying chronic lung disease.
Ultrasound machine disinfection:
Prevention of nosocomial spread of infection is of utmost importance during this pandemic and hence following appropriate machine cleaning protocols is imperative. Some considerations from POCUS standpoint while managing COVID patients:
- Perform POCUS only if you think it is going to change the management (e.g. triage, adjust ventilator settings, unexplained clinical deterioration, weaning failure etc.)
- Perform all the required scans during one session, when possible (e.g. lung, focused echo, procedural guidance etc.)
- Thoroughly clean the machine after each use (all surfaces – monitor, instrument control panel, transducers, cords/ cables, stand, transducer holders etc.)
- Use appropriate disinfectant wipes. Contact the manufacturer or your radiology department when in doubt.
- Maintain minimum ‘wet time’ = length of time that the disinfectant must remain wet on the surface for it to be effective (usually 2-3 minutes)
- Follow sequence: cleaning and disinfection must be done from the least to the most soiled areas.
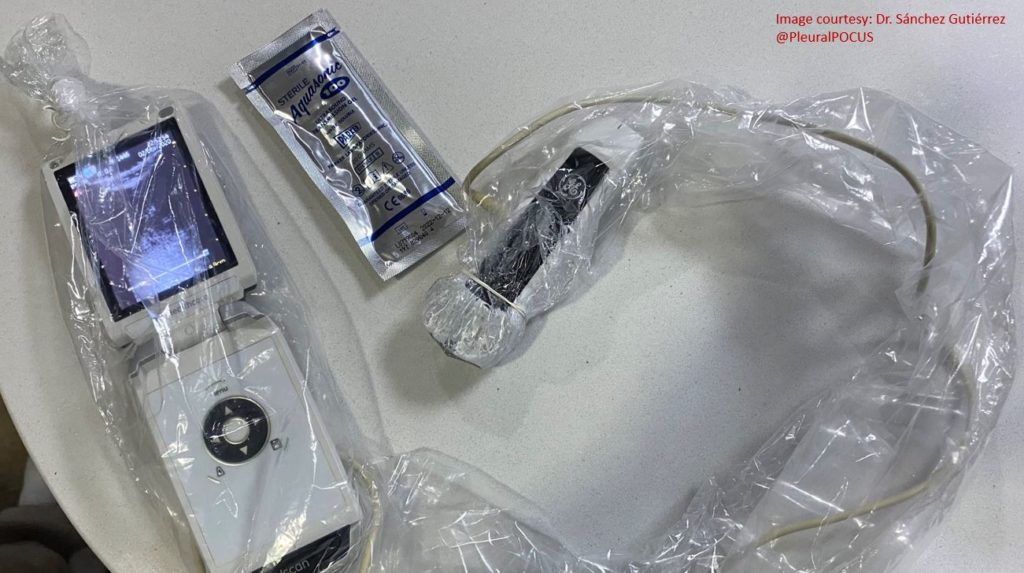
- Apply protective cover to the entire system following institutional infection-control guidelines. With hand-held ultrasound devices, can use a standard probe cover to encase the whole device [Figure 14].
- With cart-based machines, remove all unnecessary trays, baskets, transducer holders before going into patients’ room. Only take transducers that you are going to use.
- Carry single-use gel packets instead of multi-use bottles.
- POCUS should be performed by experienced user in the team (which, in fact could be an internal medicine resident and not necessarily the attending physician). This is not the time for ‘educational scans’ or training.
Abhilash Koratala, MD FASN (@NephroP)
Medical College of Wisconsin

2 comments