In the previous post, we talked about the Doppler effect, color flow and power Doppler modes. Now let us focus on the spectral Doppler. Spectral Doppler enables us to measure the velocity of blood flow as well as analyze the waveform (graphical representation of velocity over time), both of which are important in hemodynamic assessment.
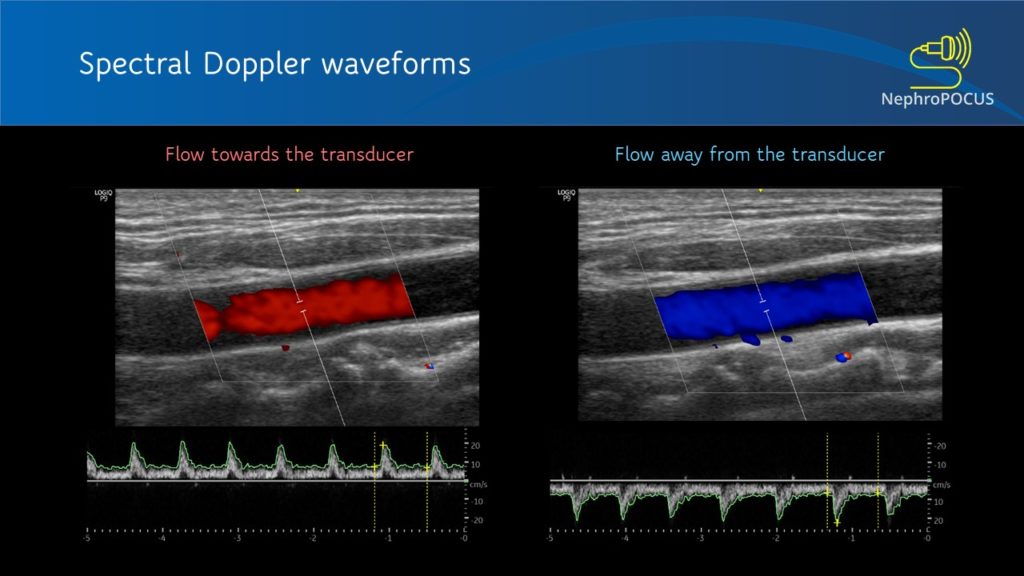
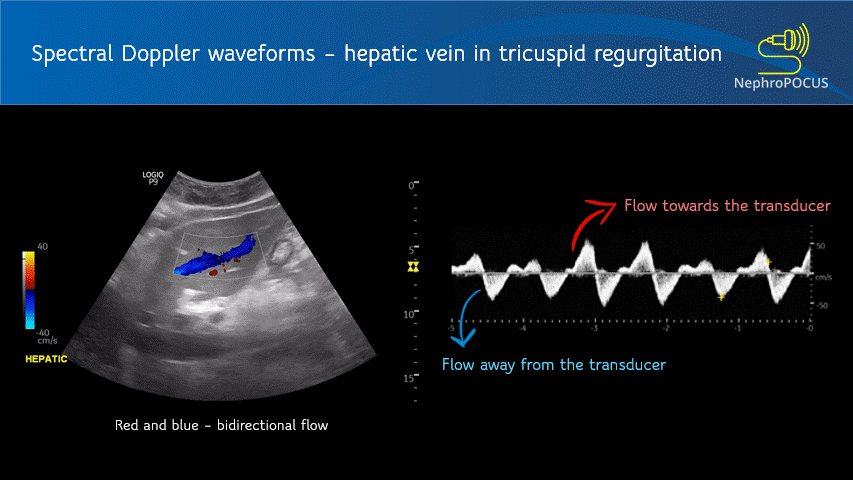
The spectral waveform is displayed above the baseline if the flow is towards the transducer (analogous to red in color Doppler) and below the baseline if the flow is away from the transducer (blue in color Doppler) [Figure 1]. Figure 2 is an example of a waveform which is both above and below the baseline, which means there is to-and-fro blood flow pattern. This hepatic vein tracing was obtained from a patient with severe tricuspid regurgitation, where blood was being pushed back by the regurgitant jet into the hepatic vein (towards transducer) during systole and going into the heart during diastole (away from the transducer).
There are two main types of spectral Doppler – pulsed-wave (PW) Doppler and continuous-wave (CW) Doppler.
- PW Doppler
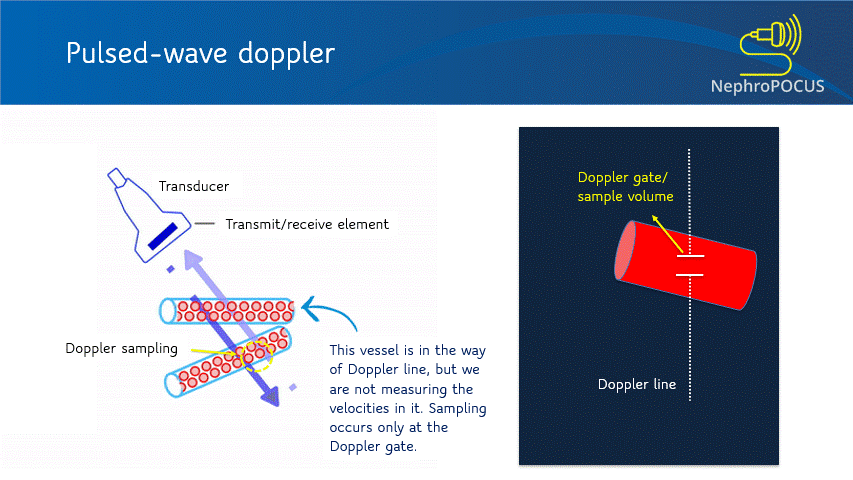
In PW Doppler mode, the transducer sends out the ultrasound waves, waits and listens to the reflected echoes (‘pulsed’ transmission). The number of ultrasound pulses emitted by the transducer per unit time is called pulse repetition frequency (PRF). As every emitted pulse is paired with a returning signal, it is possible to determine the depth/location of the reflector (RBC). That means, using PW Doppler, you can choose the exact location where you want to measure the velocities (e.g. just the center of a large vessel, just at the mitral valve leaflets etc.). When you press the PW button on the machine, a Doppler line appears on the screen with an opening called the Doppler gate or sample volume, whose width can be adjusted as needed [Figure 3]. When this gate is placed in the region/blood vessel of interest, the spectral waveform is displayed. Depending on what vessel you are imaging and the nature of the waveform, various parameters can be calculated such as peak-systolic velocity, end-diastolic velocity, pulsatility index etc.
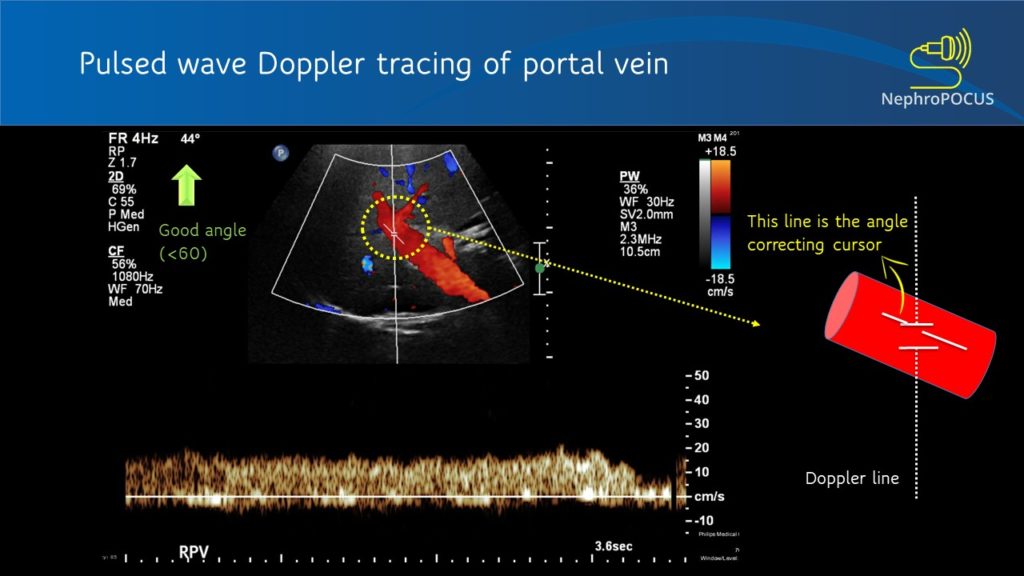
Angle correction
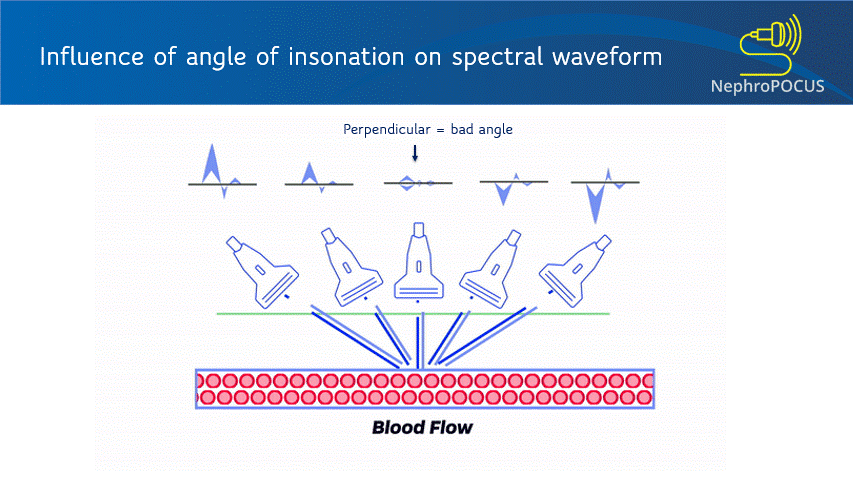
As mentioned in the previous post, the Doppler shift depends on the angle of insonation. Ideal angle is 0 degrees (parallel to flow) to get maximum Doppler shift but less than 60 degrees is acceptable (error significantly increases after that). Figure 4 illustrates how angle changes the displayed velocities. Improper angle leads to erroneous interpretation (e.g. when assessing AV access stenosis). In addition to beam steering, angle correction cursor can be used to manually adjust the angle (= a small movable line that appears at the sample volume). This is typically aligned parallel to the vessel wall [Figure 5]. Newer ultrasound machines have an auto-correction feature. Good news is that if your purpose is to just analyze the shape of the waveform or calculate fractions and do not need absolute velocities (e.g. renal resistive index), angle correction is not that important (saves time at the bedside).
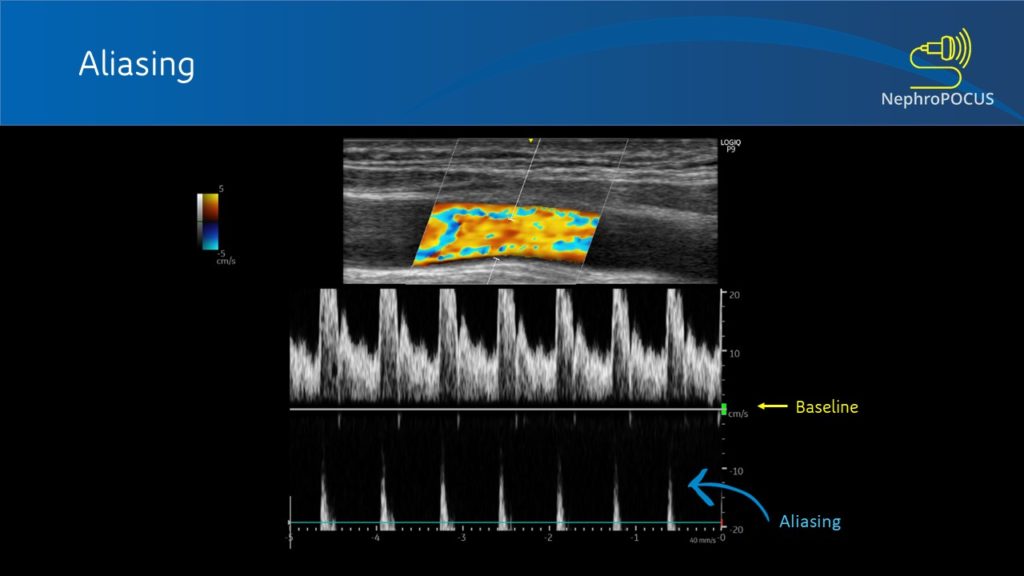
Aliasing
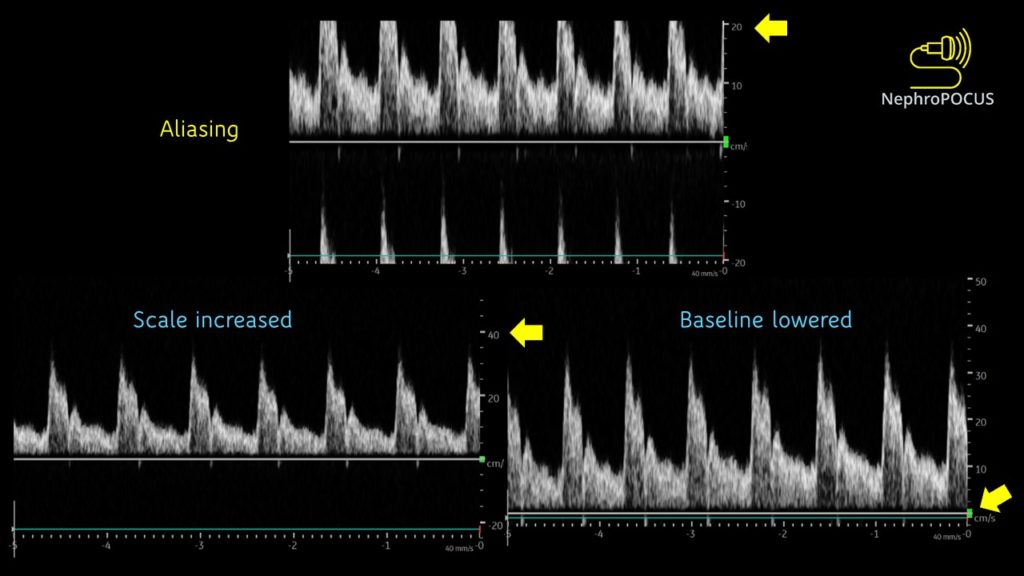
This is an important characteristic of PW Doppler that you need to be aware of. As the same transducer element is used to send and receive ultrasound pulses (= cannot listen continuously), there is a limit on the maximum velocity that can be detected. Particularly happens with deeper structures (= returning echoes take longer and the transducer is in the process of sending out next pulse before the previous echoes return completely – flow direction will be misread by the machine). When this happens, top portions of the waves are chopped off and displayed on the opposite side of the baseline. This is called aliasing [Figure 6]. This can be overcome by (1) increasing the scale [= PRF] and/ (2) lowering the baseline. Figure 7 illustrates how aliasing disappears by doing these two things. If nothing helps (e.g. velocity is too high), switch to CW Doppler.
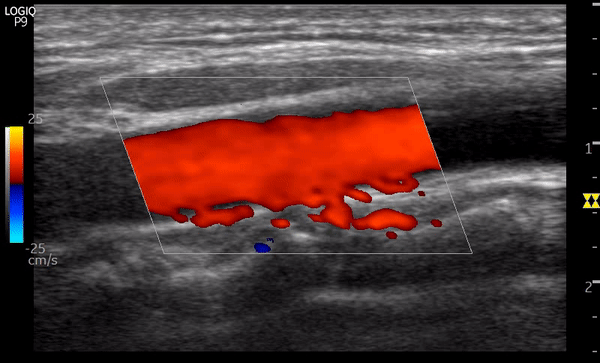
Aliasing can also be seen on color flow Doppler as mixture of colors when the scale is set too lower than expected for a particular vascular bed. This can be misinterpreted as turbulence due to stenosis. Figure 8 is a nice example showing the transition to uniform red color from mixture of colors as we increase the scale (left of the image) from 5 cm/s to 25 cm/s.
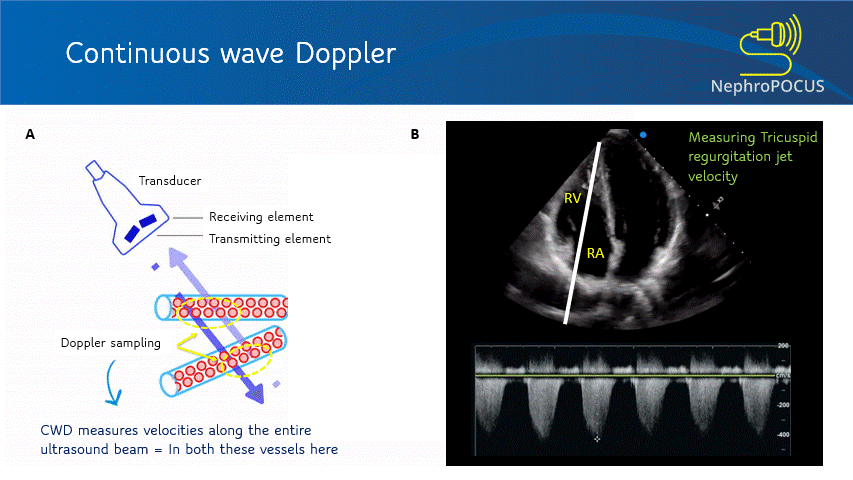
- CW Doppler
This mode utilizes two separate transducer elements – one to transmit the ultrasound waves and the other one to listen to the reflected echoes. As it can continuously listen to the returning signal, this mode is free of aliasing and displays more accurate velocity information. However, it is NOT spatially precise – meaning measures blood flow velocities along the entire ultrasound beam. The CW Doppler line/cursor does not have a gate/sample volume. It is used to measure high velocities that PW Doppler cannot accurately measure, such as trans-valvular gradients (e.g. tricuspid regurgitation signal to measure RVSP; aortic stenosis etc.) [Figure 9].
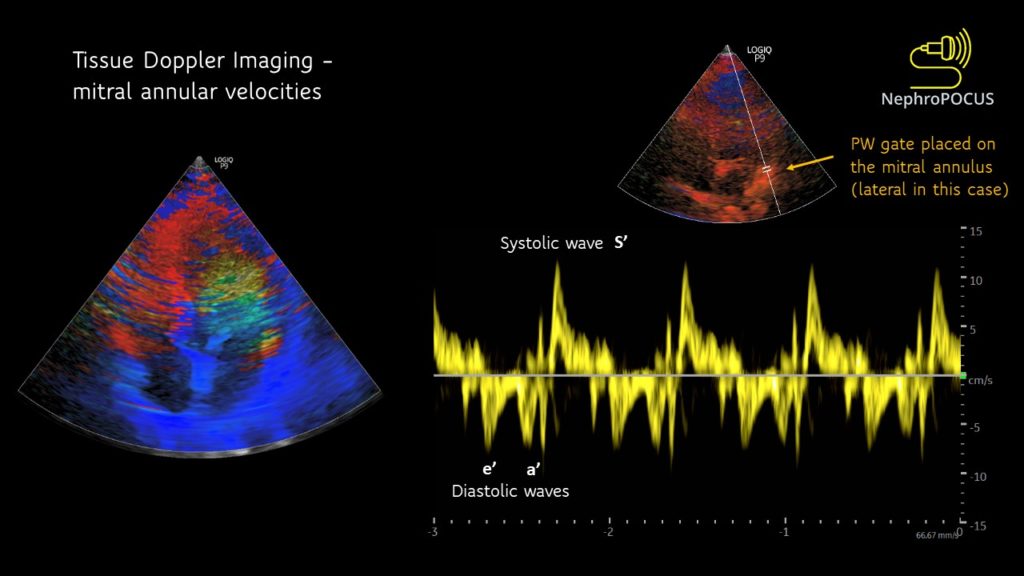
- Tissue Doppler imaging (TDI) or tissue velocity imaging (TVI)
This can be considered a type of PW Doppler that is used to measure the movement of tissue (typically myocardium) instead of blood. Used in echocardiographic applications such as measuring the mitral annular movement to evaluate left ventricular filling pressures. The velocity scale is very low compared to blood flows in the heart. When you turn on this mode, a color flow mapping of the heart appears (the heart walls light up; not blood). Then you press the PW button and place the sample volume at the region of interest. Mitral annular tracing is shown in figure 10. Description of these waveforms/filling pressure estimation is beyond the scope of this post and will be discussed in the future along with other pertinent Doppler applications.
Abhilash Koratala, MD (@NephroP)
Medical College of Wisconsin

Refreshing 😁👍
Good
I really appreciate this post. Thank you so much Dr. Koratala
Really good. Congratulations and thank you so much.
Carlos
Very informative article. Although I am practicing ultrasound since long time, even then I got my k owledge refresh.thanks for sharing.