Abhilash Koratala, MD, FASN @NephroP, Medical College of Wisconsin
Identification of pericardial effusion is one of the basic applications of focused cardiac ultrasound (FoCUS). As previously discussed, pericardial effusion appears as an anechoic or echo-free space between the two layers of the pericardium (complex effusions may have internal echoes or septations). Parasternal long axis and subxiphoid 4-chamber views are commonly used for this purpose. As it is not always possible to obtain adequate images from all the standard echocardiographic windows, it is important to be familiar with the appearance of pericardial effusion on different cardiac views. In addition, pleural effusions and ascites may mimic pericardial effusion and confuse novice POCUS users. In this post, lets us see some examples and get a mental construct of the relevant anatomy. If you are not familiar with basic cardiac views, please go through the previous Focus on POCUN posts.
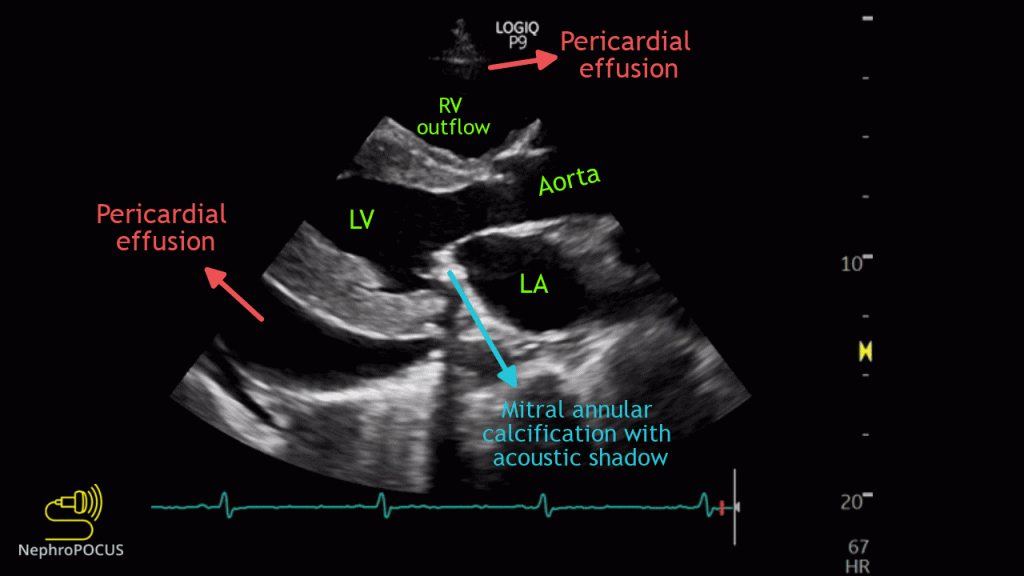
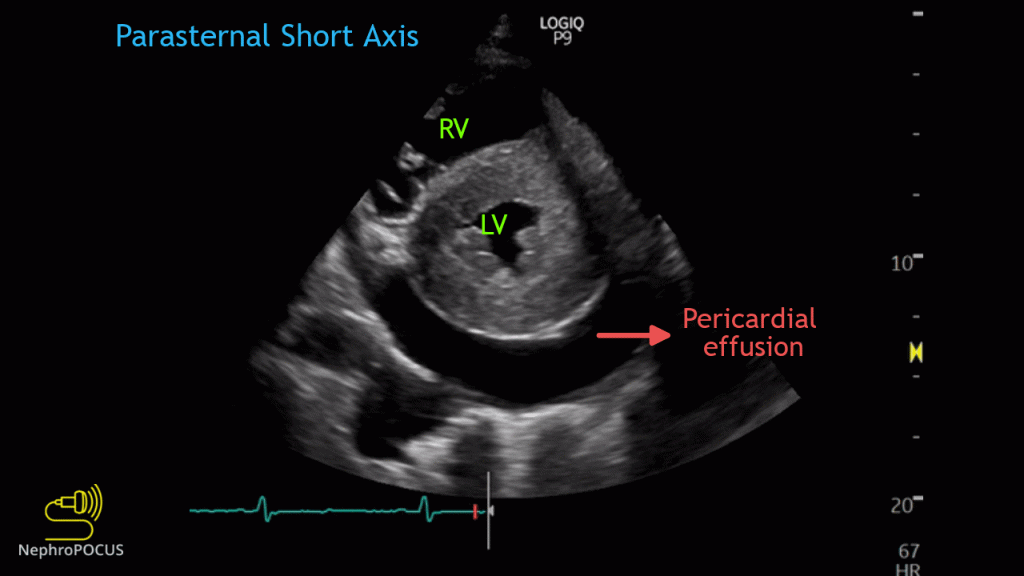
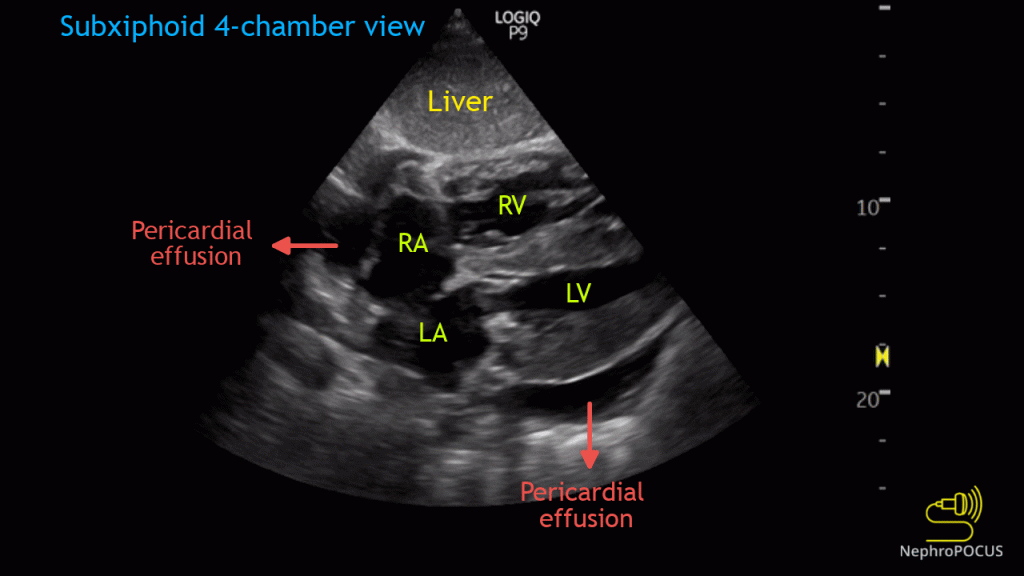
Here is an example of a relatively large pericardial effusion (>2 cm separation in diastole) as seen on parasternal long and short axes, apical 4-chamber, and subxiphoid 4-chamber views (Figures 1-4). Images were obtained from an end-stage kidney disease patient on hemodialysis. Concentric left ventricular hypertrophy (LVH) and mitral annular calcification seen here are frequent accompaniments in this patient population. Echocardiographic diagnosis of LVH is based on LV mass index, but for POCUS purposes, if the septal wall is >1.2 cm in diastole, its thick. In secondary disease (CKD), hypertrophy is usually symmetric and hence this simplified parameter works fine. In our patient, the septal diameter is >2 cm in diastole and is considered severe LVH (pay attention to the scale).


We should also be able to recognize the presence of pericardial effusion in the subxiphoid inferior vena cava (IVC) view, a common POCUS scan zone in day-to-day nephrology practice. Figure 5 demonstrates a case of pericardial effusion seen in this view.

Now let us talk about other effusions. Visualization of left pleural effusion on the parasternal long axis view is the most important of all as it is frequently confused with pericardial effusion by POCUS learners. Suboptimal images increase the chance of this misidentification. In this view, descending thoracic aorta is the anatomical landmark that differentiates between these two effusions. Fluid anterior to the descending aorta (toward the top of the screen) is pericardial effusion and the fluid at or posterior is likely pleural effusion. Moreover, pleural effusion will most likely have atelectatic lung floating in the fluid. Even if its not there, remember that pleural effusion follows the curvature of the chest wall while pericardial effusion wedges anterior to the aorta. Make sure to increase the depth to be able to see the chest wall. Below are some sonographic examples demonstrating this concept as well as anatomic correlation using a CT scan cross section (Figures 6-8). CT section is not the exact ultrasound plane but demonstrates the relations nicely.


In lean patients, you may actually see both left and right pleural effusions from the parasternal window by appropriately increasing the depth. Here is an example (Figure 9).

Post reviewed by: Sam Kant, Abhilash Koratala


